QUESTION IMAGE
Question
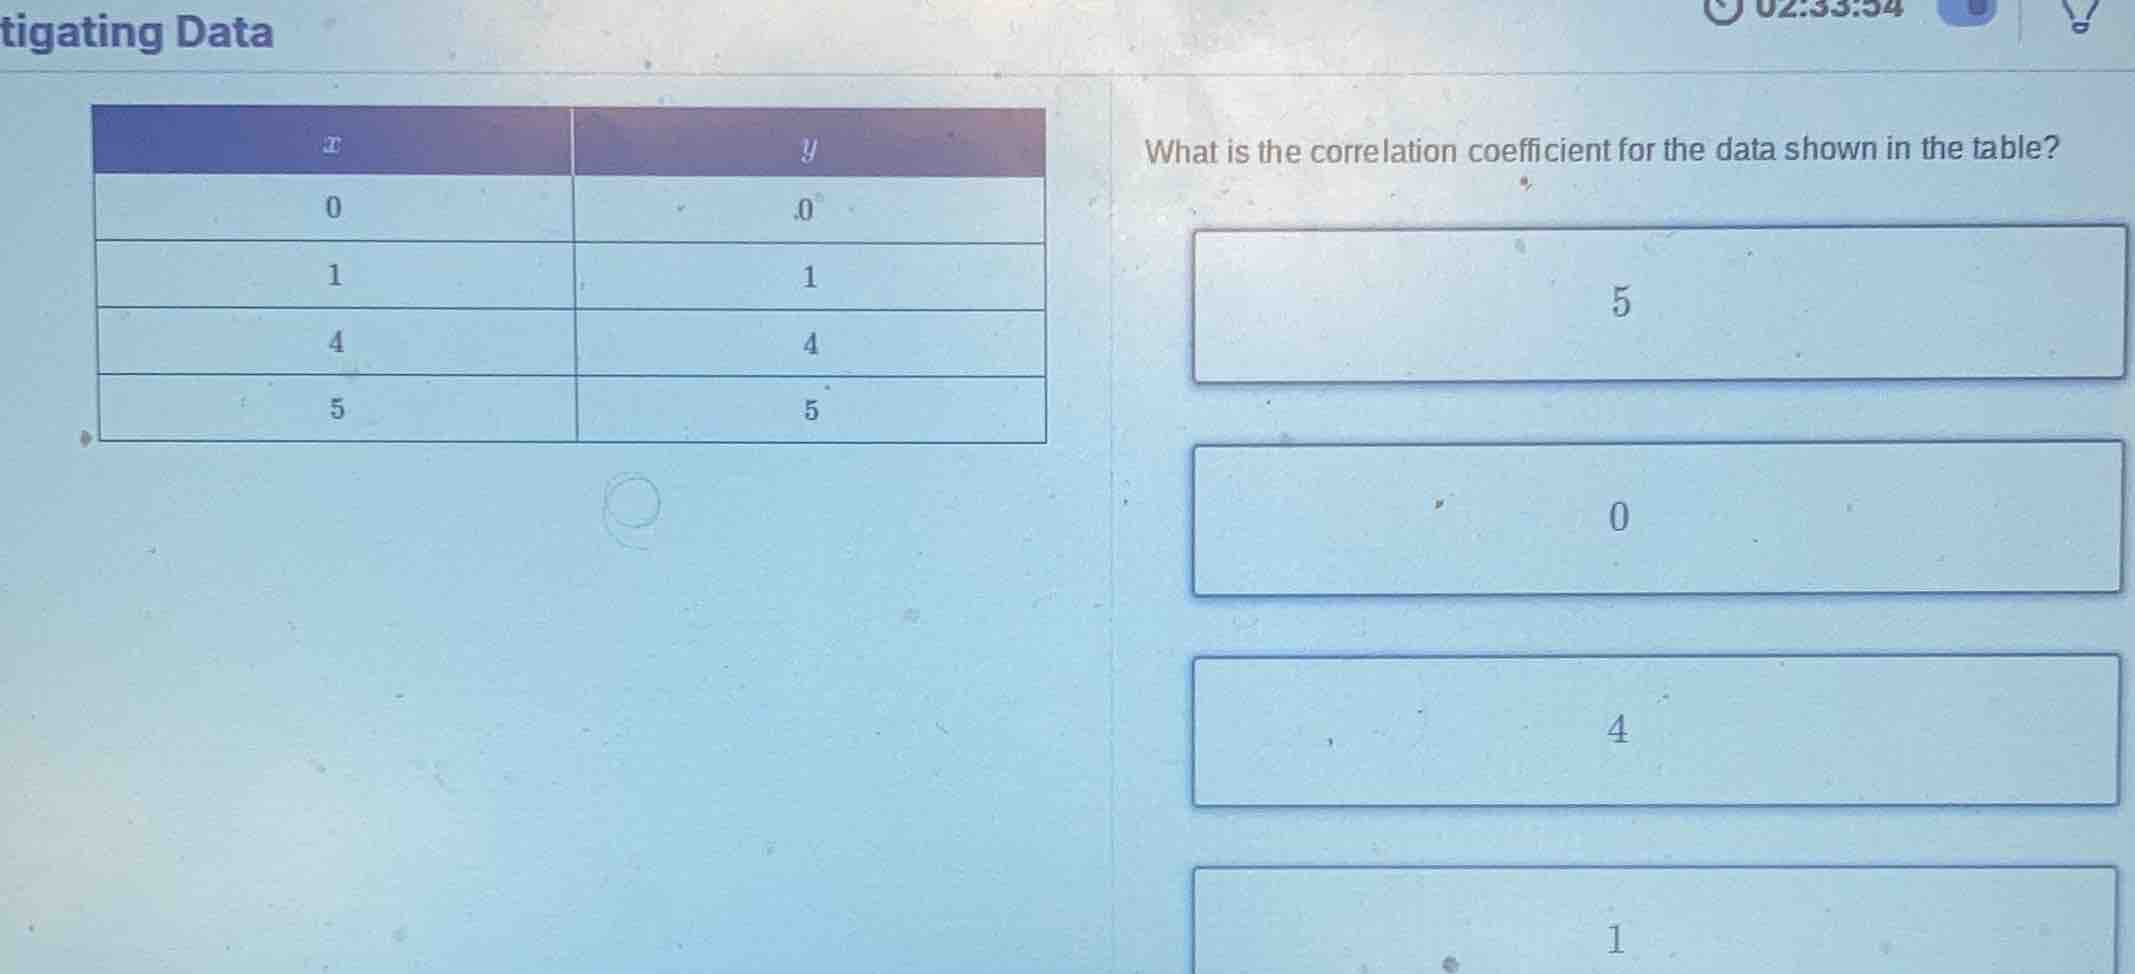
what is the correlation coefficient for the data shown in the table? (table with x and y values: x=0,y=0; x=1,y=1; x=4,y=4; x=5,y=5) options: 5, 0, 4, 1
Step1: Analyze the data pattern
The data points are (0,0), (1,1), (4,4), (5,5). Notice that \( y = x \) for all given \( x \) and \( y \) values.
Step2: Recall correlation coefficient concept
The correlation coefficient \( r \) measures the strength and direction of a linear relationship between two variables. For a perfect positive linear relationship (where \( y \) increases exactly as \( x \) increases, and \( y = mx + b \) with \( m>0 \) and all points lying on the line), the correlation coefficient \( r = 1 \). Since here \( y=x \) (a perfect positive linear relationship), the correlation coefficient should be 1.

Snap & solve any problem in the app
Get step-by-step solutions on Sovi AI
Photo-based solutions with guided steps
Explore more problems and detailed explanations
1 (the option with value 1)