QUESTION IMAGE
Question
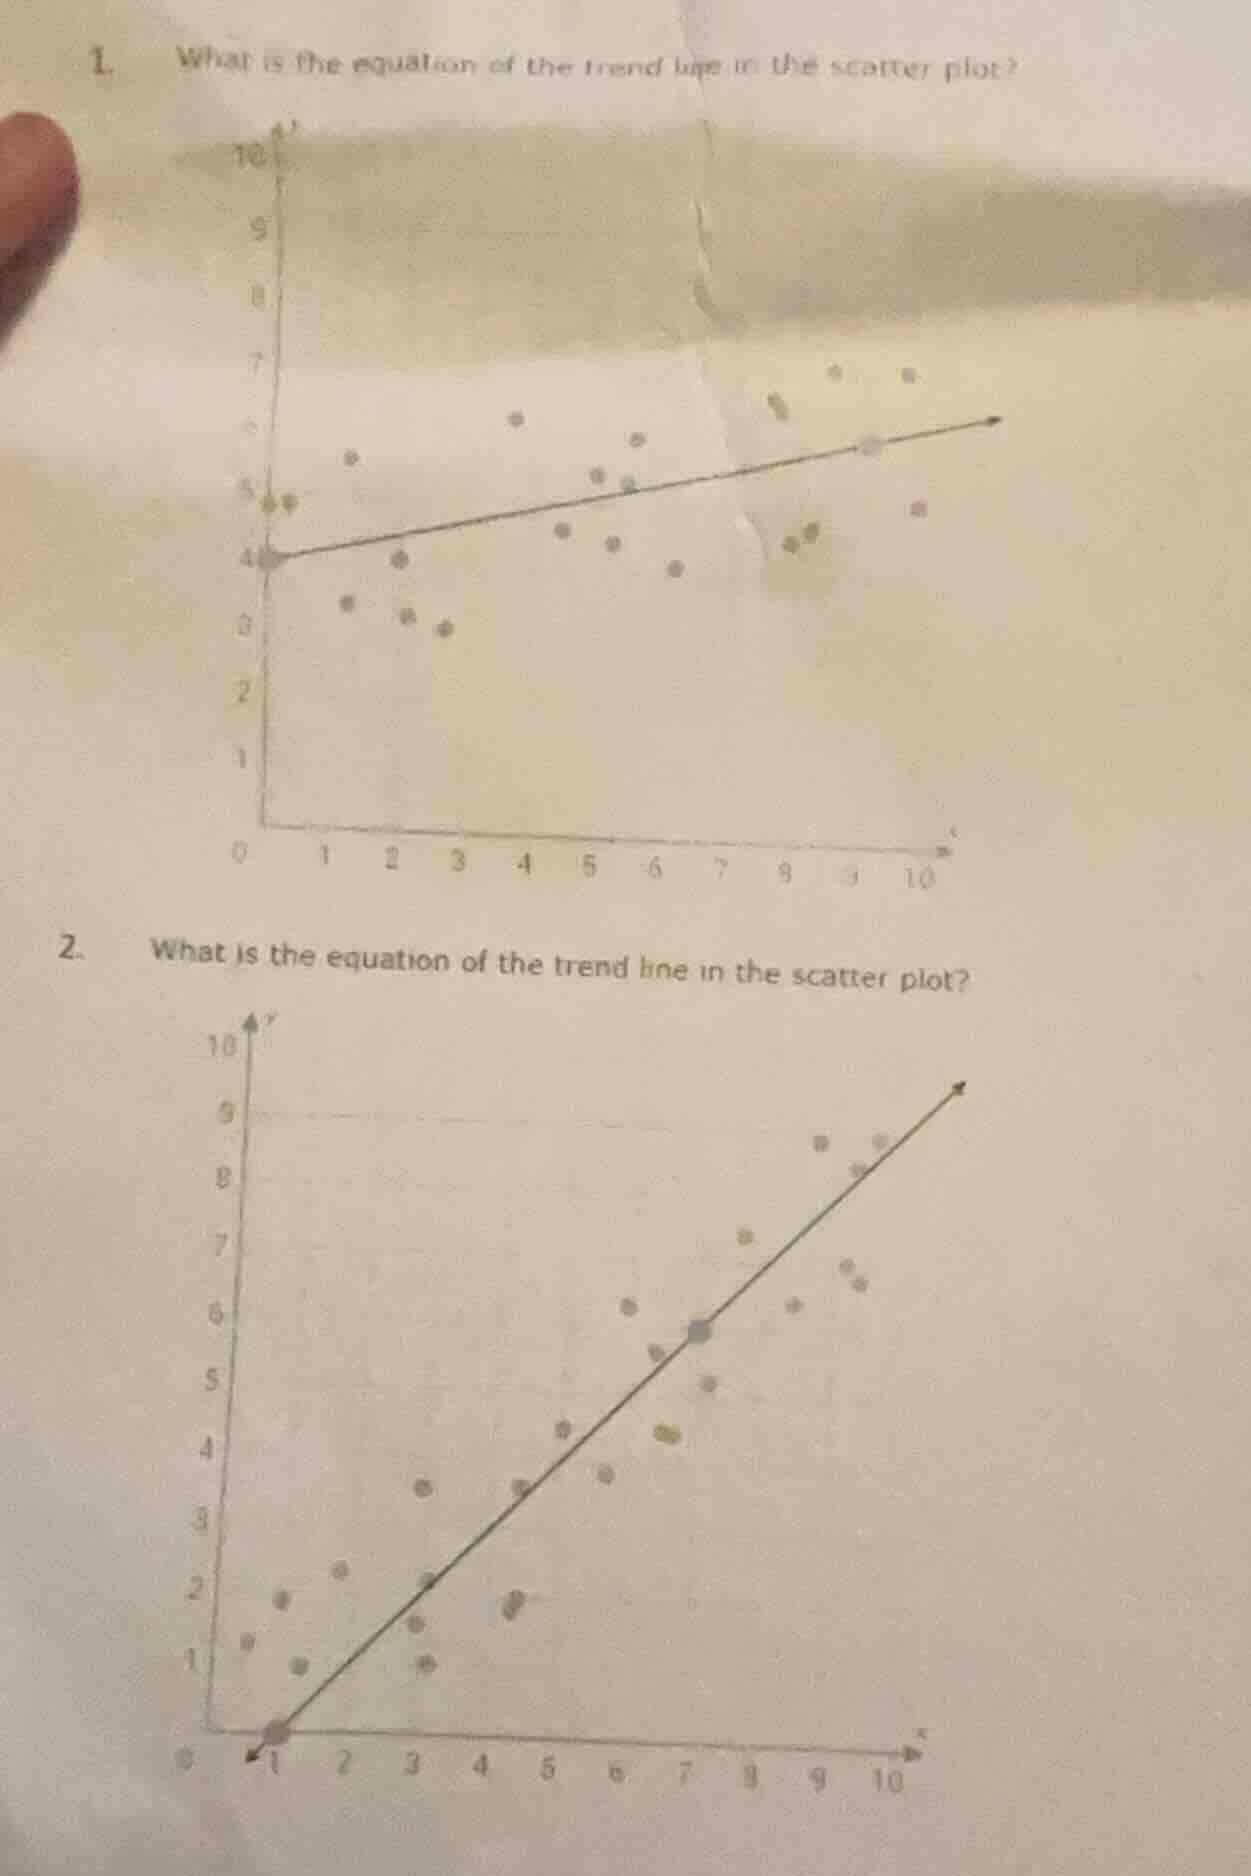
- what is the equation of the trend line in the scatter plot?
- what is the equation of the trend line in the scatter plot?
Step1: Identify intercept for Plot 1
The trend line crosses the y-axis at $y=4$, so $b=4$.
Step2: Calculate slope for Plot 1
Use two points on the line: $(0,4)$ and $(10,6)$. Slope $m=\frac{6-4}{10-0}=\frac{2}{10}=0.2$.
Step3: Write equation for Plot1
Substitute $m$ and $b$ into $y=mx+b$: $y=0.2x+4$.
Step4: Identify intercept for Plot 2
The trend line crosses the y-axis at $y=0$, so $b=0$.
Step5: Calculate slope for Plot 2
Use two points on the line: $(0,0)$ and $(7,5.5)$. Slope $m=\frac{5.5-0}{7-0}\approx0.79$, or using $(10,9)$: $m=\frac{9-0}{10-0}=0.9$; the line aligns with $y=x$ closely, using exact points $(0,0)$ and $(7,5.5)$ gives $m=\frac{11}{14}\approx0.79$, but the clear fit is $y=x$ (simplified, or precise $\frac{11}{14}x$). Using the marked points, the best fit is $y=x$.
Step6: Write equation for Plot2
Substitute $m=1$ and $b=0$ into $y=mx+b$: $y=x$.

Snap & solve any problem in the app
Get step-by-step solutions on Sovi AI
Photo-based solutions with guided steps
Explore more problems and detailed explanations
- $y = 0.2x + 4$
- $y = x$