QUESTION IMAGE
Question
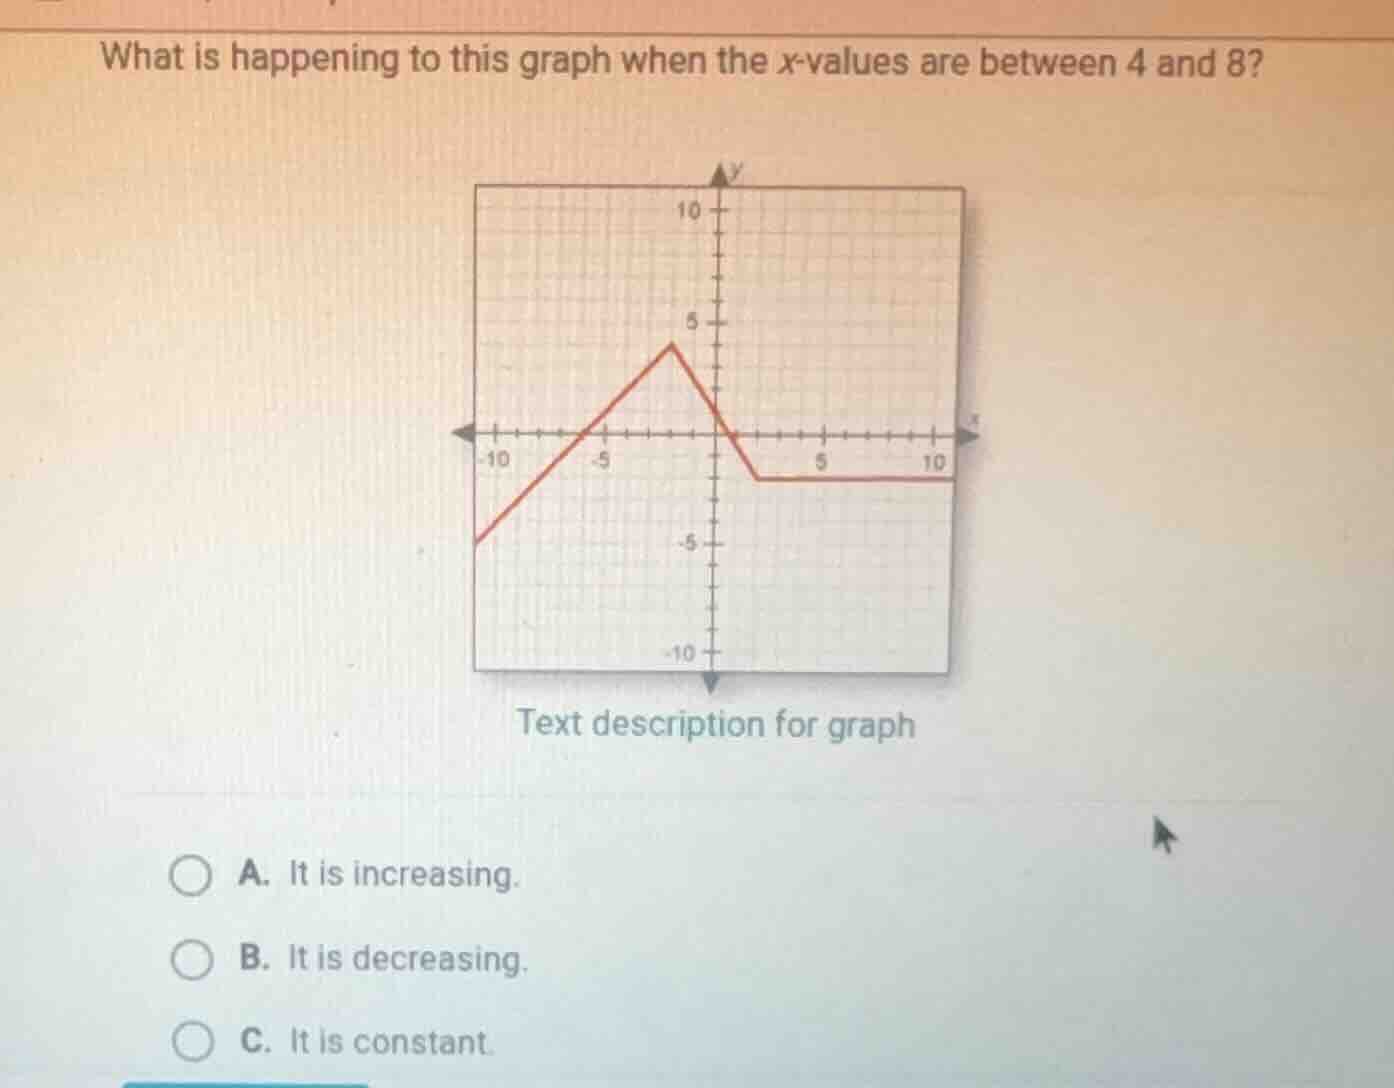
what is happening to this graph when the x-values are between 4 and 8?
text description for graph
a. it is increasing.
b. it is decreasing.
c. it is constant.
To determine the behavior of the graph between \( x = 4 \) and \( x = 8 \), we analyze the graph's slope. A constant graph has a horizontal line (slope = 0), meaning \( y \)-values don't change as \( x \) increases. From the graph, between \( x = 4 \) and \( x = 8 \), the line is horizontal, so \( y \)-values remain the same (constant) as \( x \) increases. Option A (increasing) would mean \( y \) rises with \( x \), and B (decreasing) would mean \( y \) falls with \( x \), but the graph is flat here.

Snap & solve any problem in the app
Get step-by-step solutions on Sovi AI
Photo-based solutions with guided steps
Explore more problems and detailed explanations
C. It is constant.