QUESTION IMAGE
Question
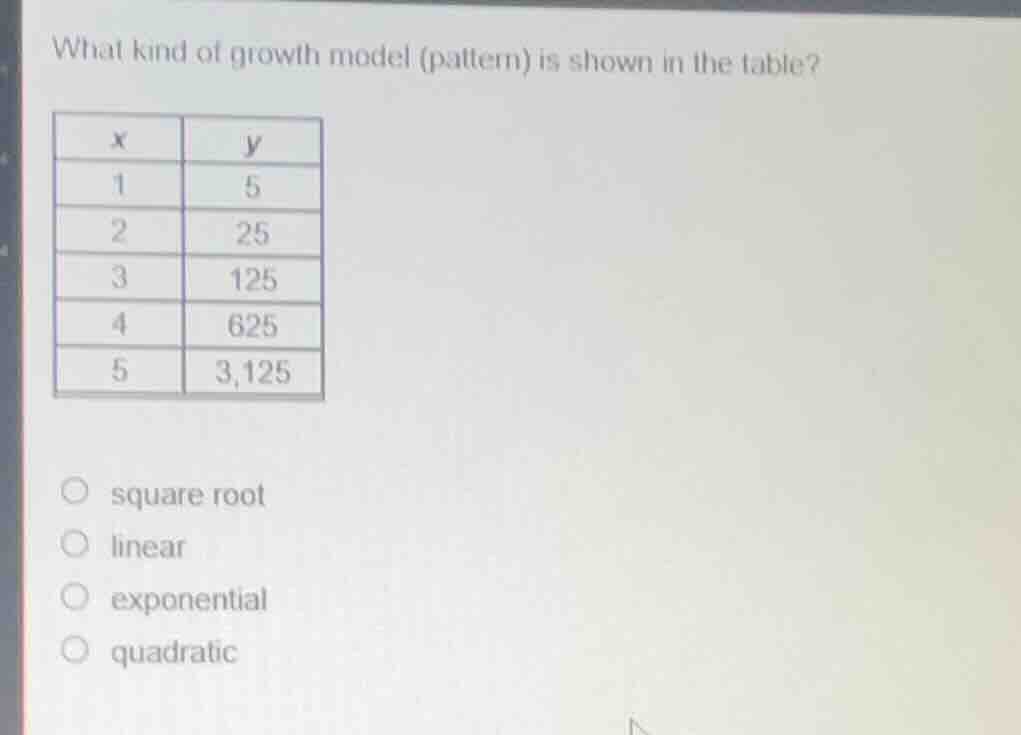
what kind of growth model (pattern) is shown in the table?
x | y
1 | 5
2 | 25
3 | 125
4 | 625
5 | 3,125
options: square root, linear, exponential, quadratic
Step1: Check linear growth
Linear growth has a constant difference between consecutive $y$-values.
Difference 1: $25 - 5 = 20$; Difference 2: $125 - 25 = 100$; Difference 3: $625 - 125 = 500$. Differences are not constant, so not linear.
Step2: Check quadratic growth
Quadratic growth has a constant second difference of $y$-values.
First differences: $20, 100, 500, 2500$. Second differences: $100-20=80$, $500-100=400$. Second differences are not constant, so not quadratic.
Step3: Check square root growth
Square root growth means $y$ is proportional to $\sqrt{x}$. For $x=1$, $\sqrt{1}=1$, $y=5$; for $x=2$, $\sqrt{2}\approx1.414$, $y$ would need to be $\approx7.07$, not 25. So not square root.
Step4: Check exponential growth
Exponential growth has a constant ratio between consecutive $y$-values.
Ratio 1: $\frac{25}{5}=5$; Ratio 2: $\frac{125}{25}=5$; Ratio 3: $\frac{625}{125}=5$; Ratio 4: $\frac{3125}{625}=5$. The ratio is constant ($5$), so this is exponential growth.

Snap & solve any problem in the app
Get step-by-step solutions on Sovi AI
Photo-based solutions with guided steps
Explore more problems and detailed explanations
exponential