QUESTION IMAGE
Question
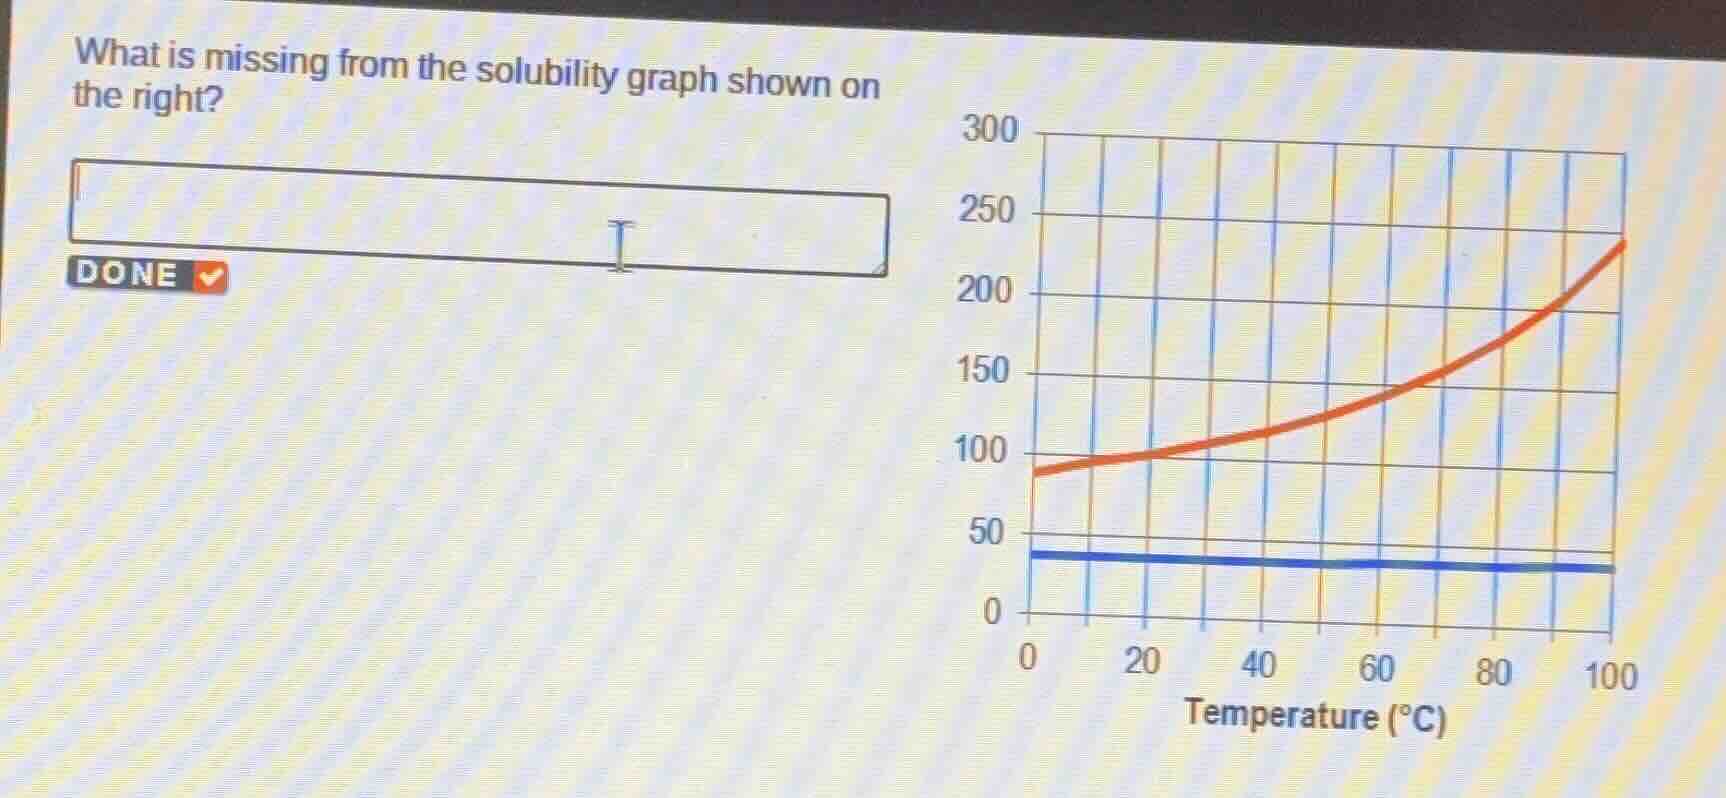
what is missing from the solubility graph shown on the right?
Brief Explanations
A proper solubility graph requires a label for the y-axis to indicate what solubility measurement (e.g., grams of solute per 100 grams of water) is being plotted, and a legend/label to identify which substances the red and blue lines represent. The given graph only has the x-axis labeled as temperature, with no y-axis units/description or substance identifiers for the curves.

Snap & solve any problem in the app
Get step-by-step solutions on Sovi AI
Photo-based solutions with guided steps
Explore more problems and detailed explanations
The graph is missing:
- A label for the y-axis (indicating the solubility unit, e.g., g solute/100 g H₂O)
- Identifiers/legend for the two lines (to show which substances' solubility is plotted)