QUESTION IMAGE
Question
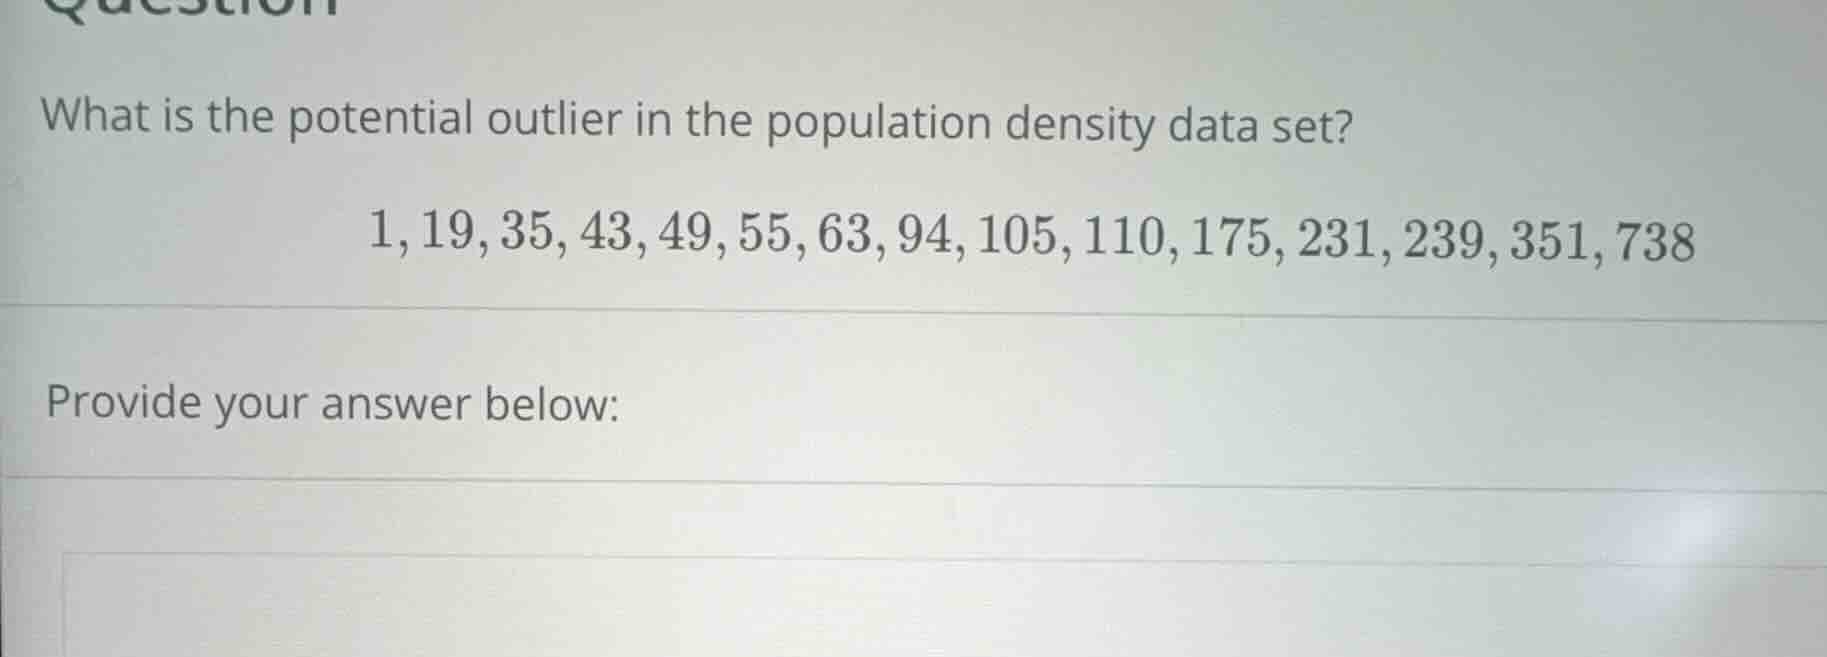
what is the potential outlier in the population density data set? 1,19,35,43,49,55,63,94,105,110,175,231,239,351,738 provide your answer below:
Step1: Find the median (Q2)
The data set has 15 values. The median is the 8th value (since \( (15 + 1)/2 = 8 \)). Sorting the data (already sorted): \( 1, 19, 35, 43, 49, 55, 63, 94, 105, 110, 175, 231, 239, 351, 738 \). So \( Q2 = 94 \).
Step2: Find Q1 (median of lower half)
Lower half: \( 1, 19, 35, 43, 49, 55, 63 \) (7 values). Median is the 4th value: \( Q1 = 43 \).
Step3: Find Q3 (median of upper half)
Upper half: \( 105, 110, 175, 231, 239, 351, 738 \) (7 values). Median is the 4th value: \( Q3 = 231 \).
Step4: Calculate IQR
\( IQR = Q3 - Q1 = 231 - 43 = 188 \).
Step5: Find lower and upper bounds
Lower bound: \( Q1 - 1.5 \times IQR = 43 - 1.5 \times 188 = 43 - 282 = -239 \).
Upper bound: \( Q3 + 1.5 \times IQR = 231 + 1.5 \times 188 = 231 + 282 = 513 \).
Step6: Identify outliers
Check values: 738 > 513, so 738 is an outlier. Also, 1 is above lower bound (-239), so not an outlier.

Snap & solve any problem in the app
Get step-by-step solutions on Sovi AI
Photo-based solutions with guided steps
Explore more problems and detailed explanations
738