QUESTION IMAGE
Question
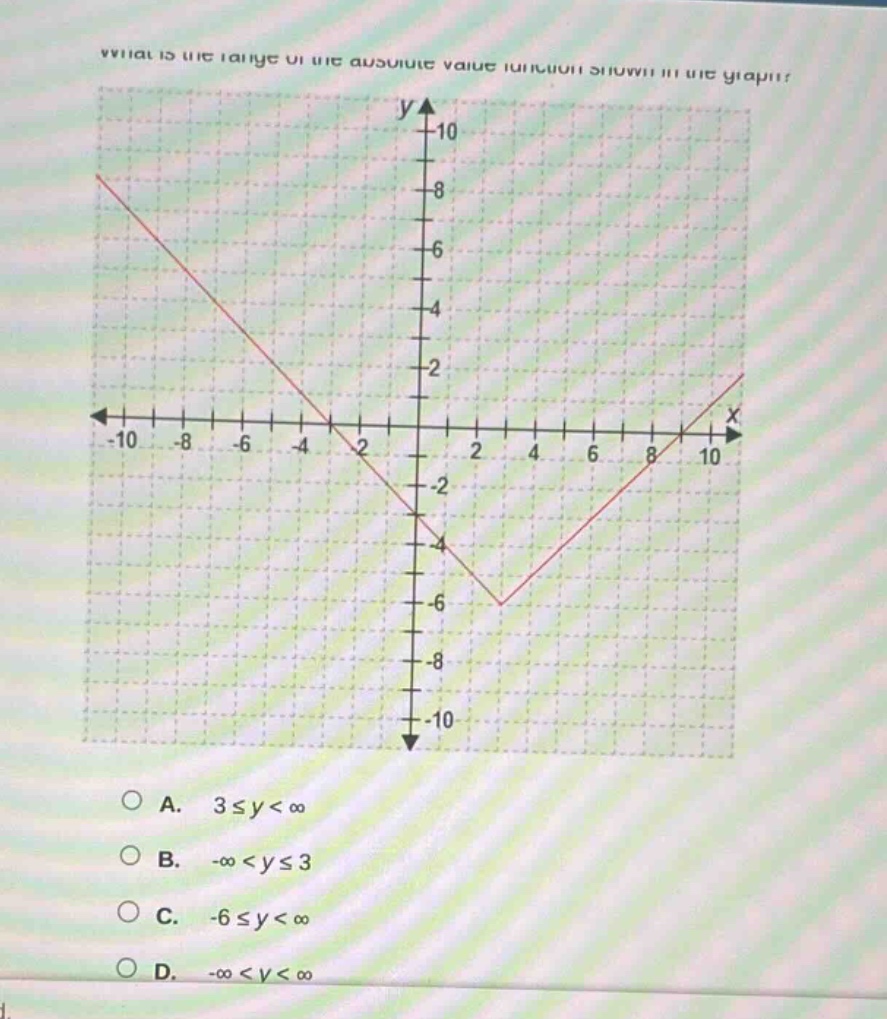
what is the range of the absolute value function shown in the graph?
options:
a. ( 3 leq y < infty )
b. ( -infty < y leq 3 )
c. ( -6 leq y < infty )
d. ( -infty < y < infty )
Step1: Understand the range of a function
The range of a function is the set of all possible output values (y - values) it can take. For a graph, we look at the lowest and highest points on the y - axis that the graph reaches.
Step2: Analyze the graph of the absolute - value function
Looking at the given graph of the absolute - value function, we can see that the vertex (the minimum point of the absolute - value graph) has a y - coordinate of - 6. And as x moves towards positive or negative infinity, the graph goes upwards (since it's an absolute - value function, which has a "V" - shape and in this case, the arms of the "V" are going upwards from the vertex). So the smallest value of y is - 6, and y can take all values greater than or equal to - 6. Mathematically, this is written as \(-6\leq y<\infty\).

Snap & solve any problem in the app
Get step-by-step solutions on Sovi AI
Photo-based solutions with guided steps
Explore more problems and detailed explanations
C. \(-6\leq y<\infty\)