QUESTION IMAGE
Question
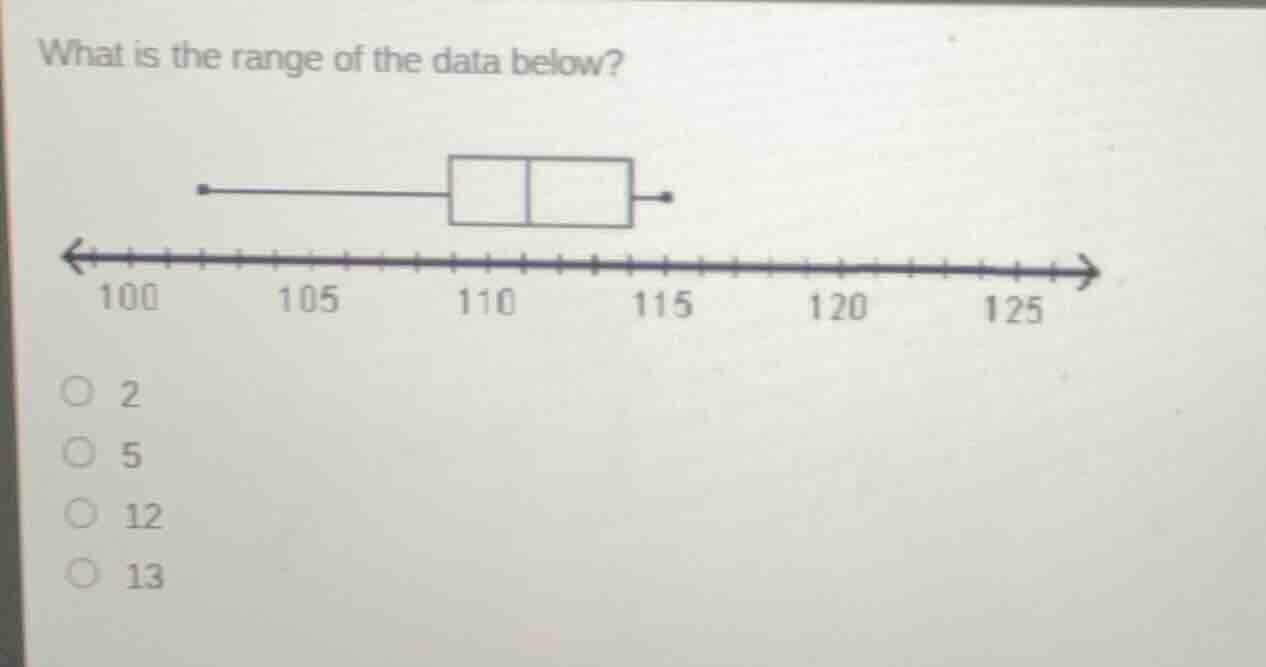
what is the range of the data below? box - plot image with number line from 100 to 125 options: 2, 5, 12, 13
Step1: Identify max and min values
From the box plot, the minimum value is 102, the maximum value is 115.
Step2: Calculate the range
Range = Max value - Min value
$\text{Range} = 115 - 102$

Snap & solve any problem in the app
Get step-by-step solutions on Sovi AI
Photo-based solutions with guided steps
Explore more problems and detailed explanations
13