QUESTION IMAGE
Question
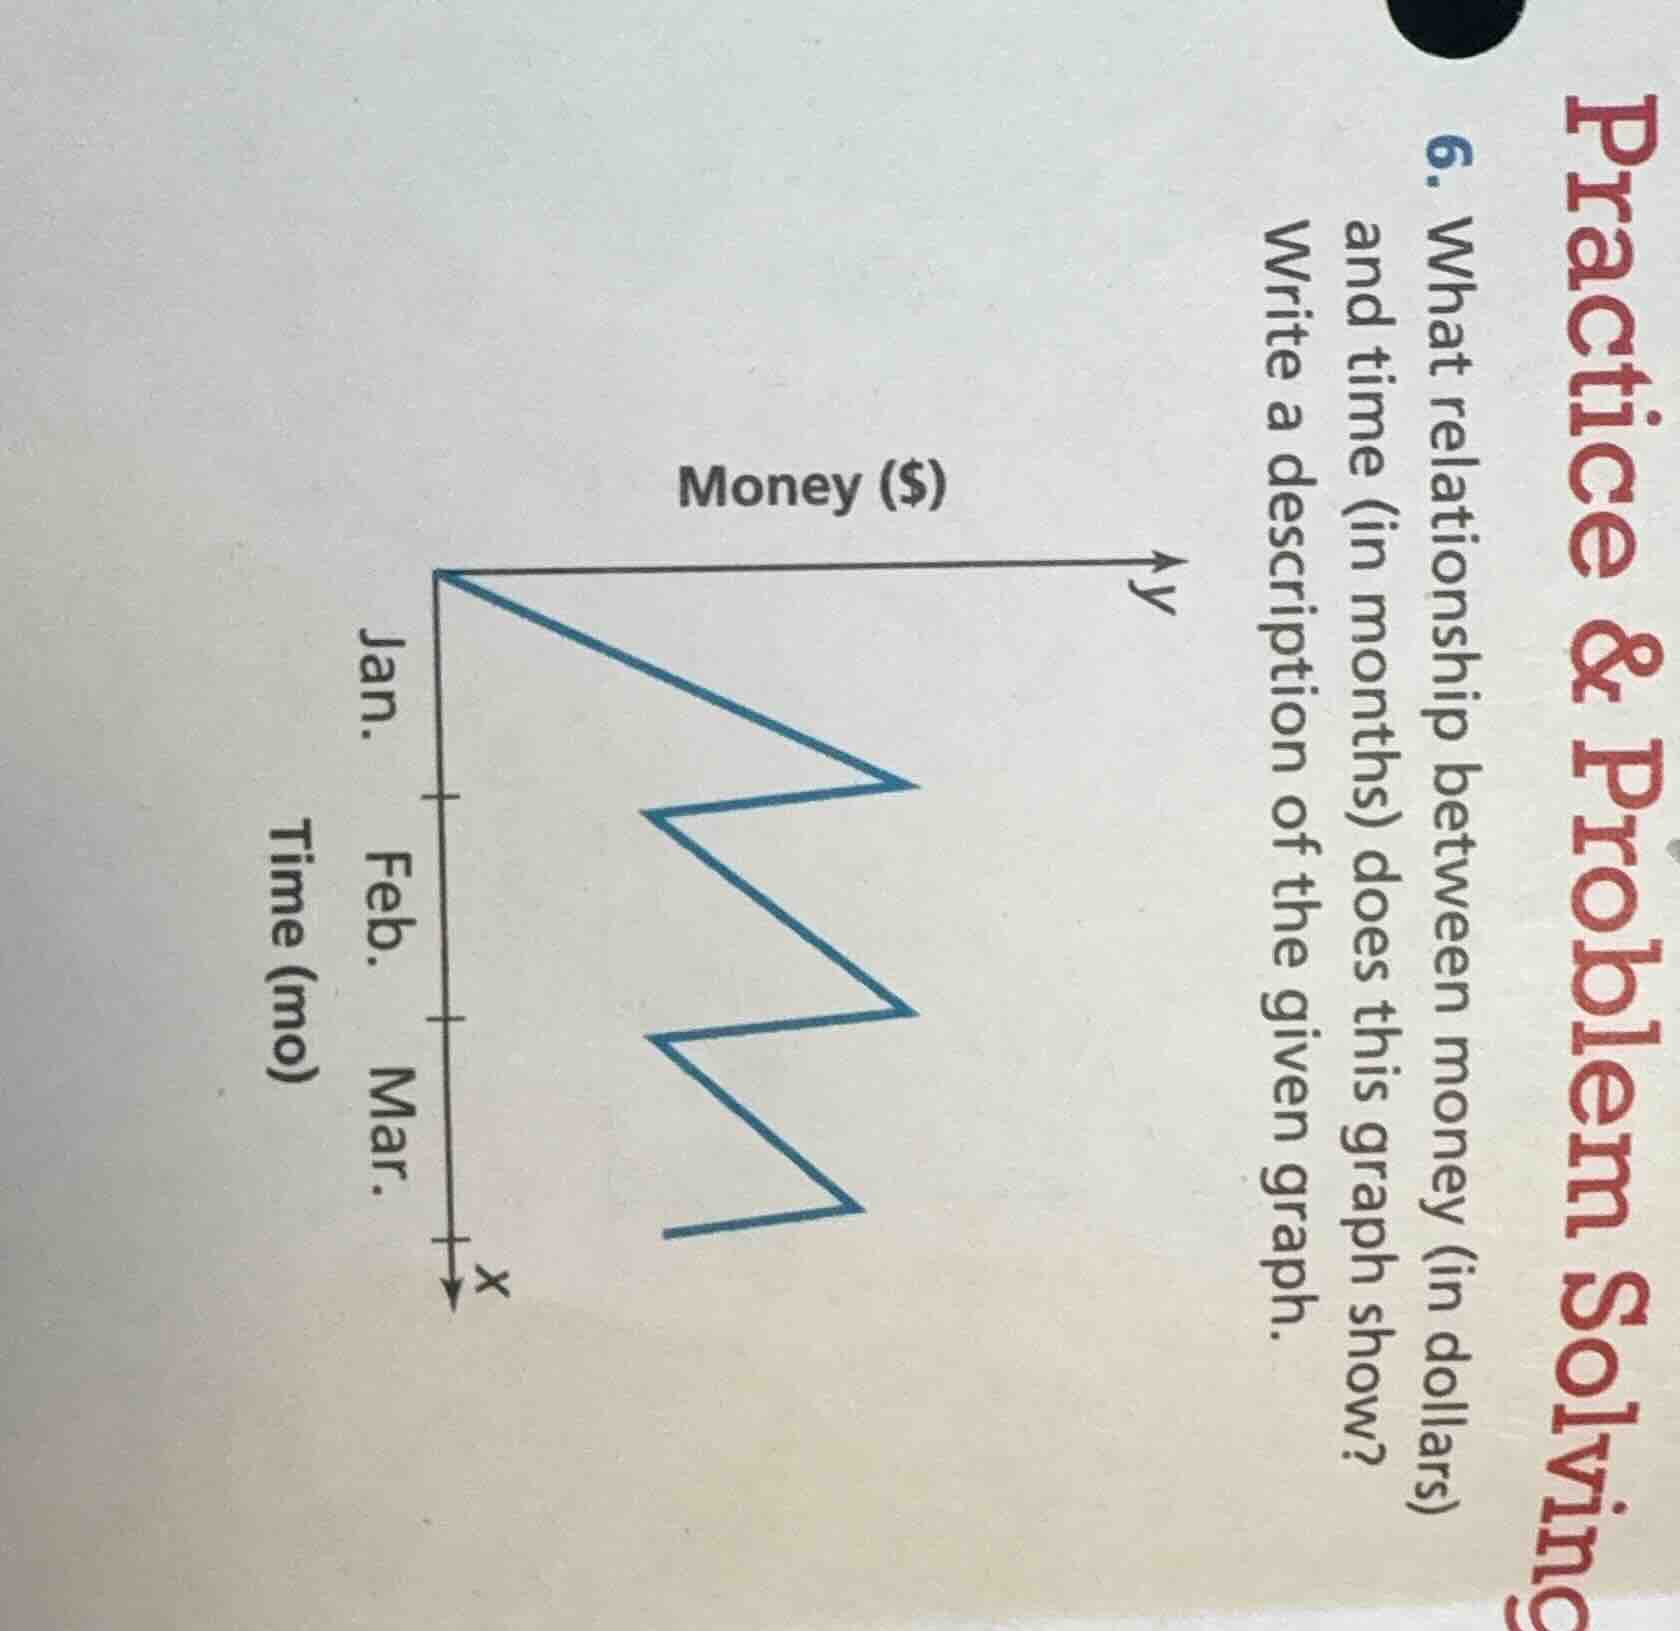
- what relationship between money (in dollars) and time (in months) does this graph show? write a description of the given graph.
Brief Explanations
- Relationship Type: The graph shows a non-linear, non-proportional relationship. Money does not change at a constant rate relative to time, and there is no consistent multiplicative or linear link between the two variables.
- Graph Description: Starting in January, the amount of money first decreases over a portion of the month, then increases for a shorter period, creating a downward-pointing "zig-zag" pattern. This same cycle of decreasing then increasing money repeats in February and March, with each full cycle resulting in a lower overall amount of money than the start of the previous month.

Snap & solve any problem in the app
Get step-by-step solutions on Sovi AI
Photo-based solutions with guided steps
Explore more problems and detailed explanations
- The graph shows a non-linear, non-proportional relationship between money (in dollars) and time (in months).
- Over the three months from January to March, the amount of money follows a repeating cycle: it decreases over an interval of time, then increases over a shorter interval, forming a downward zig-zag pattern. Each full cycle ends with a lower total amount of money than the start of the prior cycle, meaning the overall trend of money is downward over the three-month period.