QUESTION IMAGE
Question
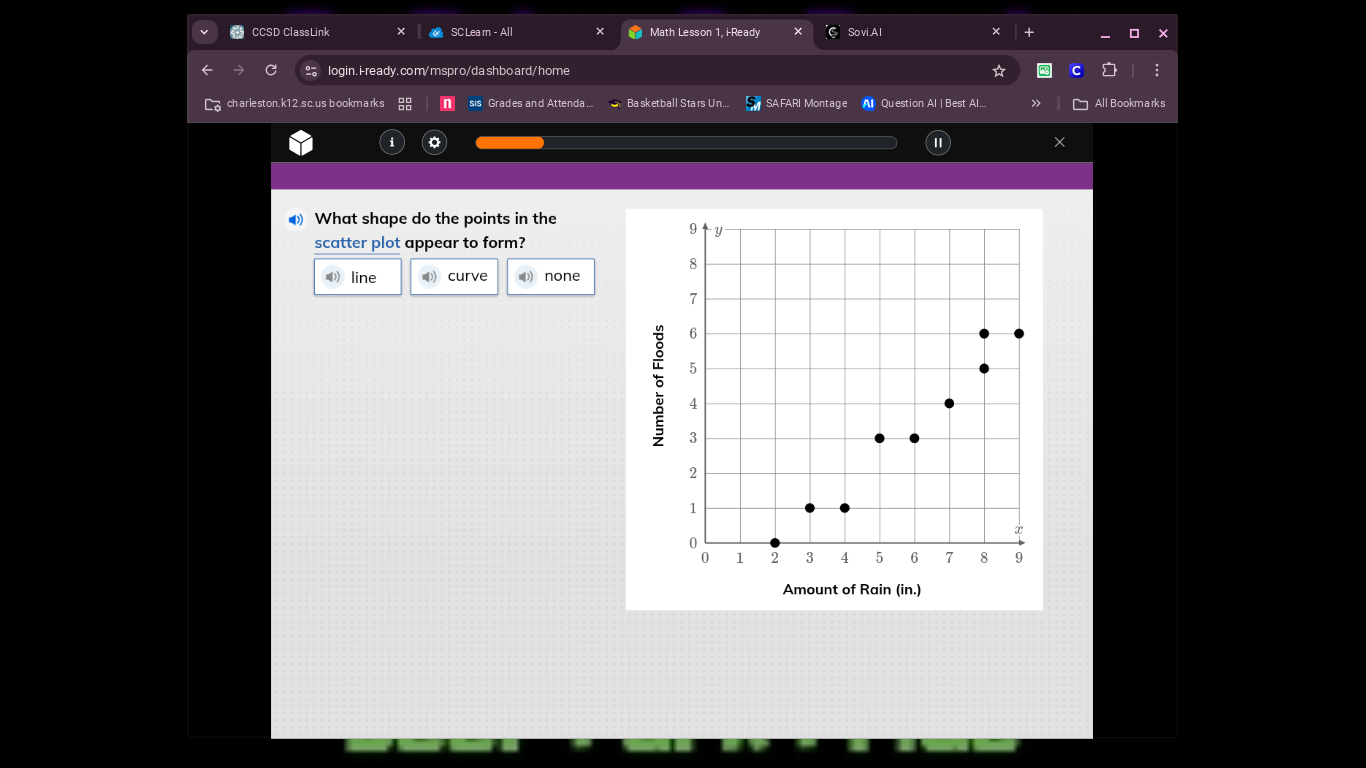
what shape do the points in the scatter plot appear to form? line curve none
Step1: Analyze the scatter plot points
Looking at the points in the scatter plot, as the amount of rain (x - axis) increases, the number of floods (y - axis) generally increases in a way that the points seem to lie close to a straight - line pattern. There is a linear trend where the points are aligned such that a straight line could be drawn to approximate their distribution. A curve would imply a non - linear, curved pattern, and "none" would mean there is no discernible pattern, but here the points show a linear trend.
Step2: Compare with options
The options are line, curve, or none. Since the points have a linear trend (they seem to form a straight - line - like pattern), the correct option is line.

Snap & solve any problem in the app
Get step-by-step solutions on Sovi AI
Photo-based solutions with guided steps
Explore more problems and detailed explanations
A. line