QUESTION IMAGE
Question
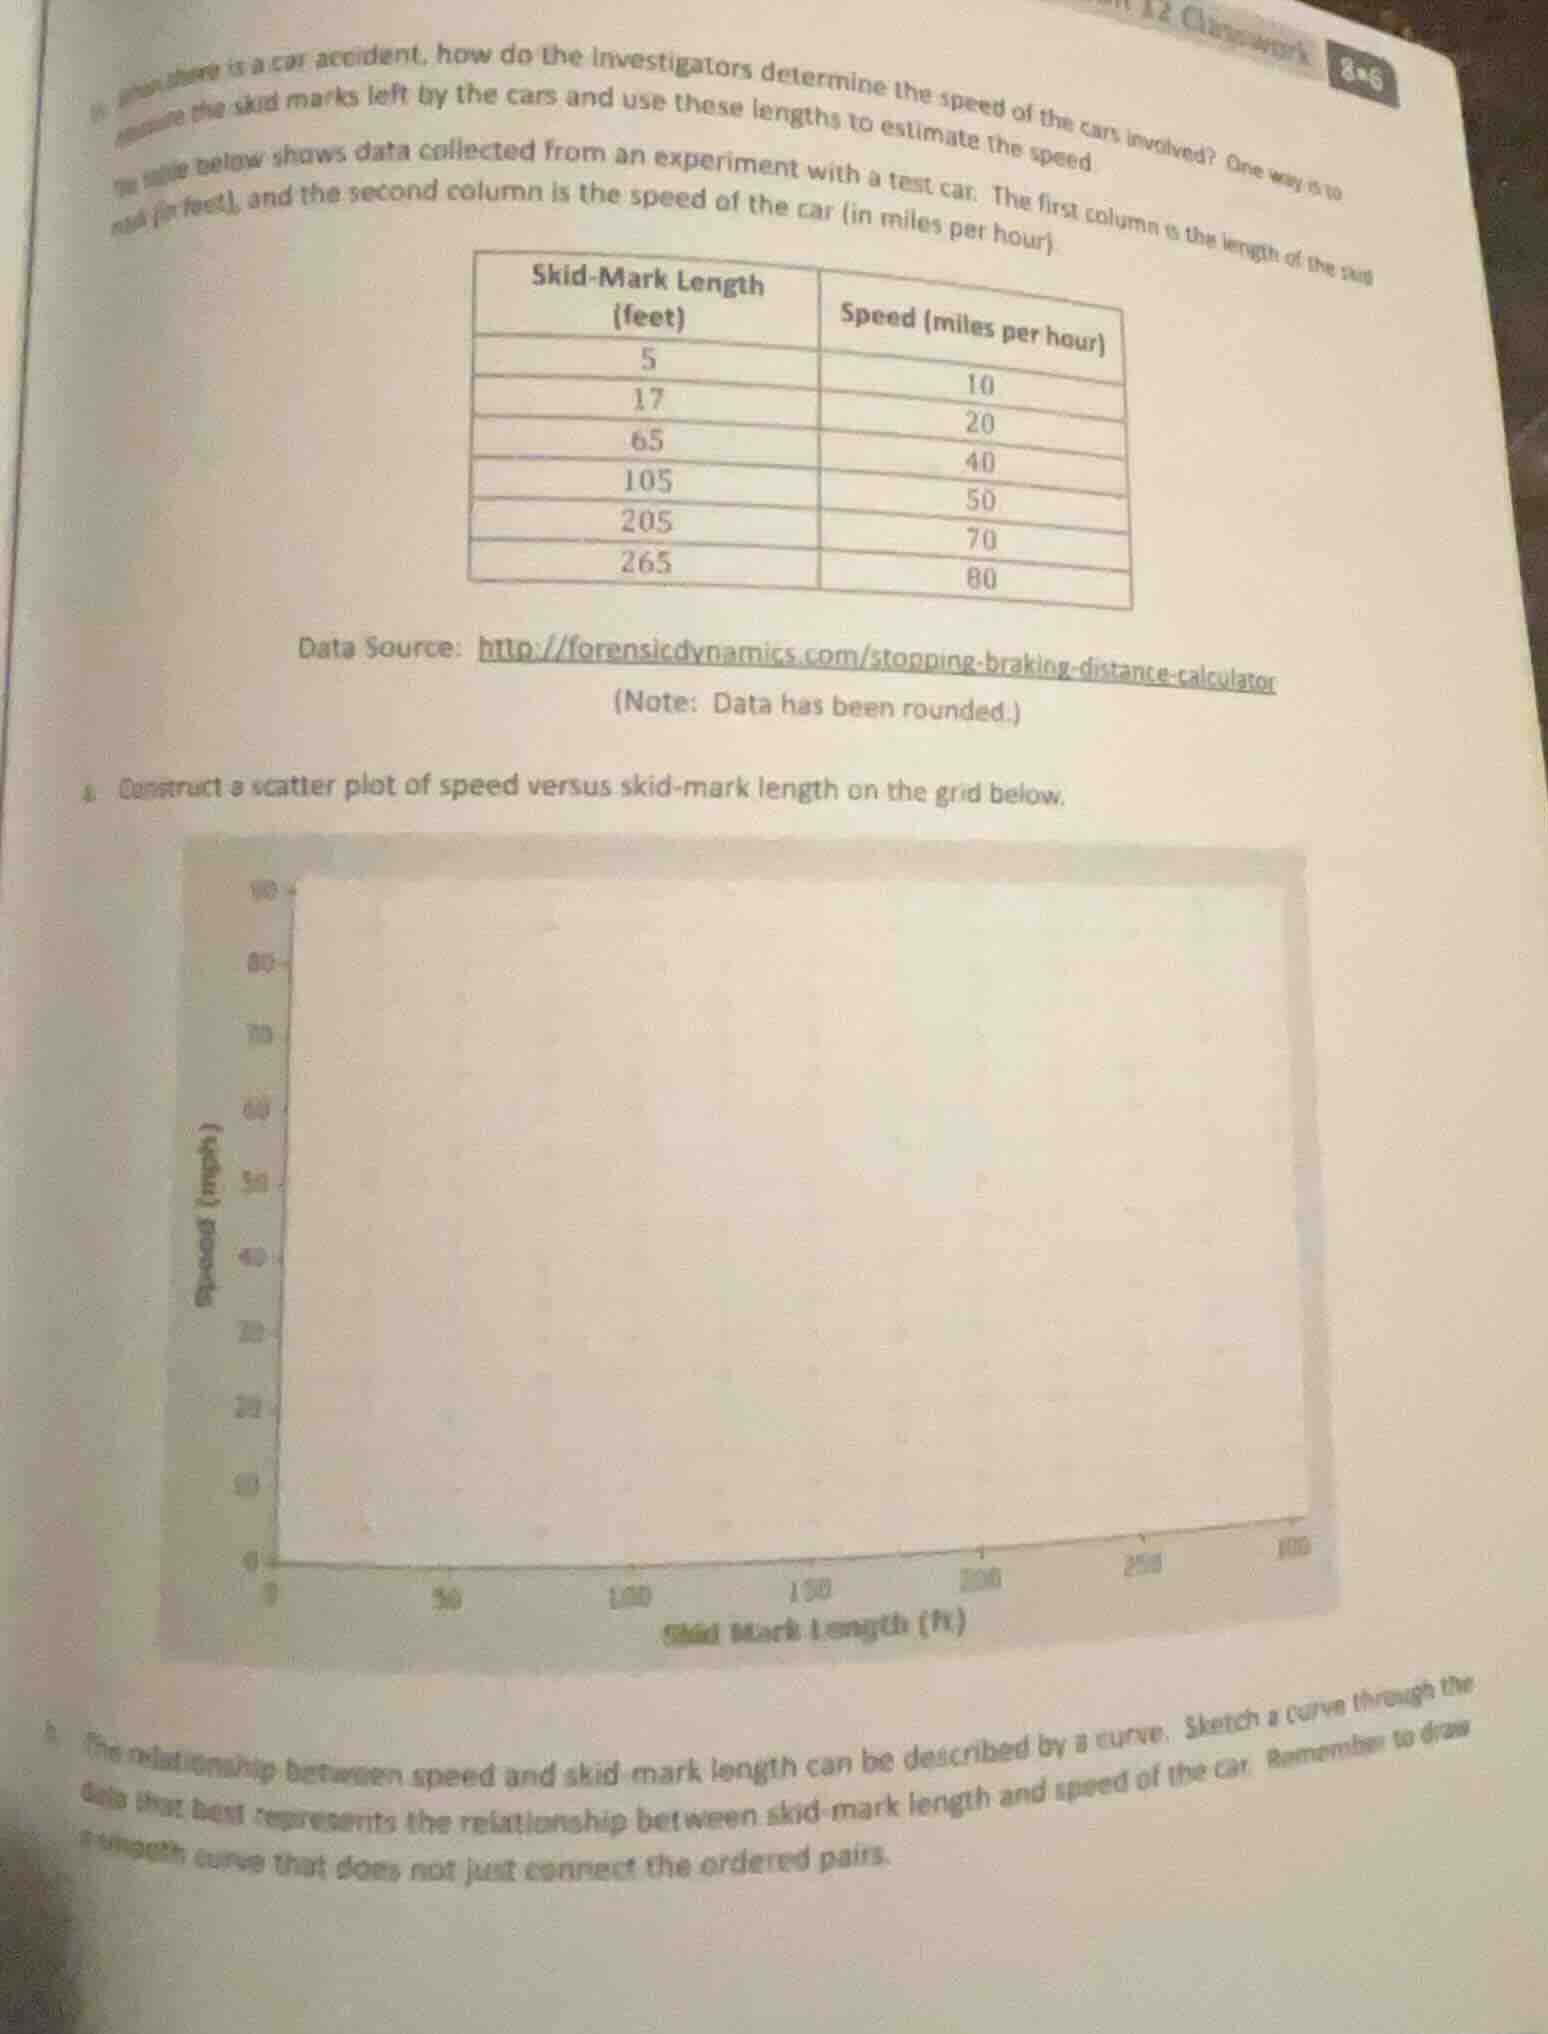
when there is a car accident, how do the investigators determine the speed of the cars involved? one way is to measure the skid marks left by the cars and use these lengths to estimate the speed.the table below shows data collected from an experiment with a test car. the first column is the length of the skid mark (in feet), and the second column is the speed of the car (in miles per hour).| skid-mark length (feet) | speed (miles per hour) || ---- | ---- || 5 | 10 || 17 | 20 || 65 | 40 || 105 | 50 || 205 | 70 || 265 | 80 |data source: http://forensicdynamics.com/stopping-braking-distance-calculator(note: data has been rounded.)a. construct a scatter plot of speed versus skid-mark length on the grid below.b. the relationship between speed and skid-mark length can be described by a curve. sketch a curve through the data that best represents the relationship between skid-mark length and speed of the car. remember to draw a smooth curve that does not just connect the ordered pairs.
Step1: Identify data points
The ordered pairs (skid length, speed) are: (5,10), (17,20), (65,40), (105,50), (205,70), (265,80)
Step2: Plot each data point
On the grid, locate each skid-mark length on the x-axis, speed on the y-axis, and mark each point.
Step3: Sketch the trend curve
Draw a smooth curve that passes near all plotted points, following the upward, increasing curvature of the data, without connecting the points directly.

Snap & solve any problem in the app
Get step-by-step solutions on Sovi AI
Photo-based solutions with guided steps
Explore more problems and detailed explanations
- Scatter Plot Points: The plotted points are at coordinates (5,10), (17,20), (65,40), (105,50), (205,70), (265,80) on the provided grid (x-axis: Skid Mark Length (ft), y-axis: Speed (mph)).
- Trend Curve: A smooth, upward-opening curve that lies close to all six plotted points, showing that speed increases with skid-mark length at an increasing rate.