QUESTION IMAGE
Question
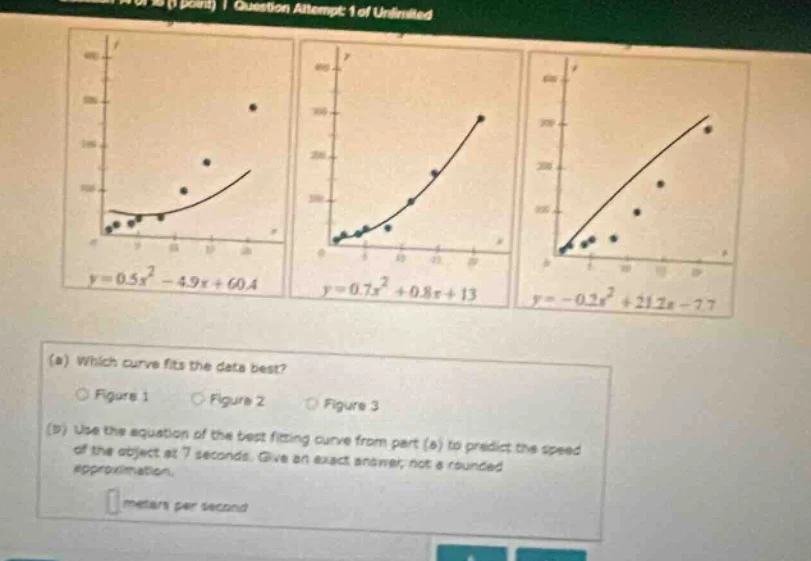
(a) which curve fits the data best?
○ figure 1 ○ figure 2 ○ figure 3
(b) use the equation of the best fitting curve from part (a) to predict the speed of the object at 7 seconds. give an exact answer; not a rounded approximation.
meters per second
$y=0.5x^{2}-4.9x+60.4$
$y=0.7x^{2}+0.8x+13$
$y=-0.2x^{2}+21.2x-7.7$
Step1: Evaluate curve fit accuracy
Visually compare each curve to its data points:
- Figure1: Points lie far above the curve.
- Figure2: Points closely follow the curve.
- Figure3: Points lie far below the curve.
Step2: Substitute x=7 into best fit equation
Use $y=0.7x^2 + 0.8x + 13$, substitute $x=7$:
$y=0.7(7)^2 + 0.8(7) + 13$
Step3: Calculate each term
First term: $0.7\times49=34.3$
Second term: $0.8\times7=5.6$
Third term: $13$
Step4: Sum the terms
$y=34.3 + 5.6 + 13$

Snap & solve any problem in the app
Get step-by-step solutions on Sovi AI
Photo-based solutions with guided steps
Explore more problems and detailed explanations
(a) Figure 2
(b) 52.9 meters per second