QUESTION IMAGE
Question
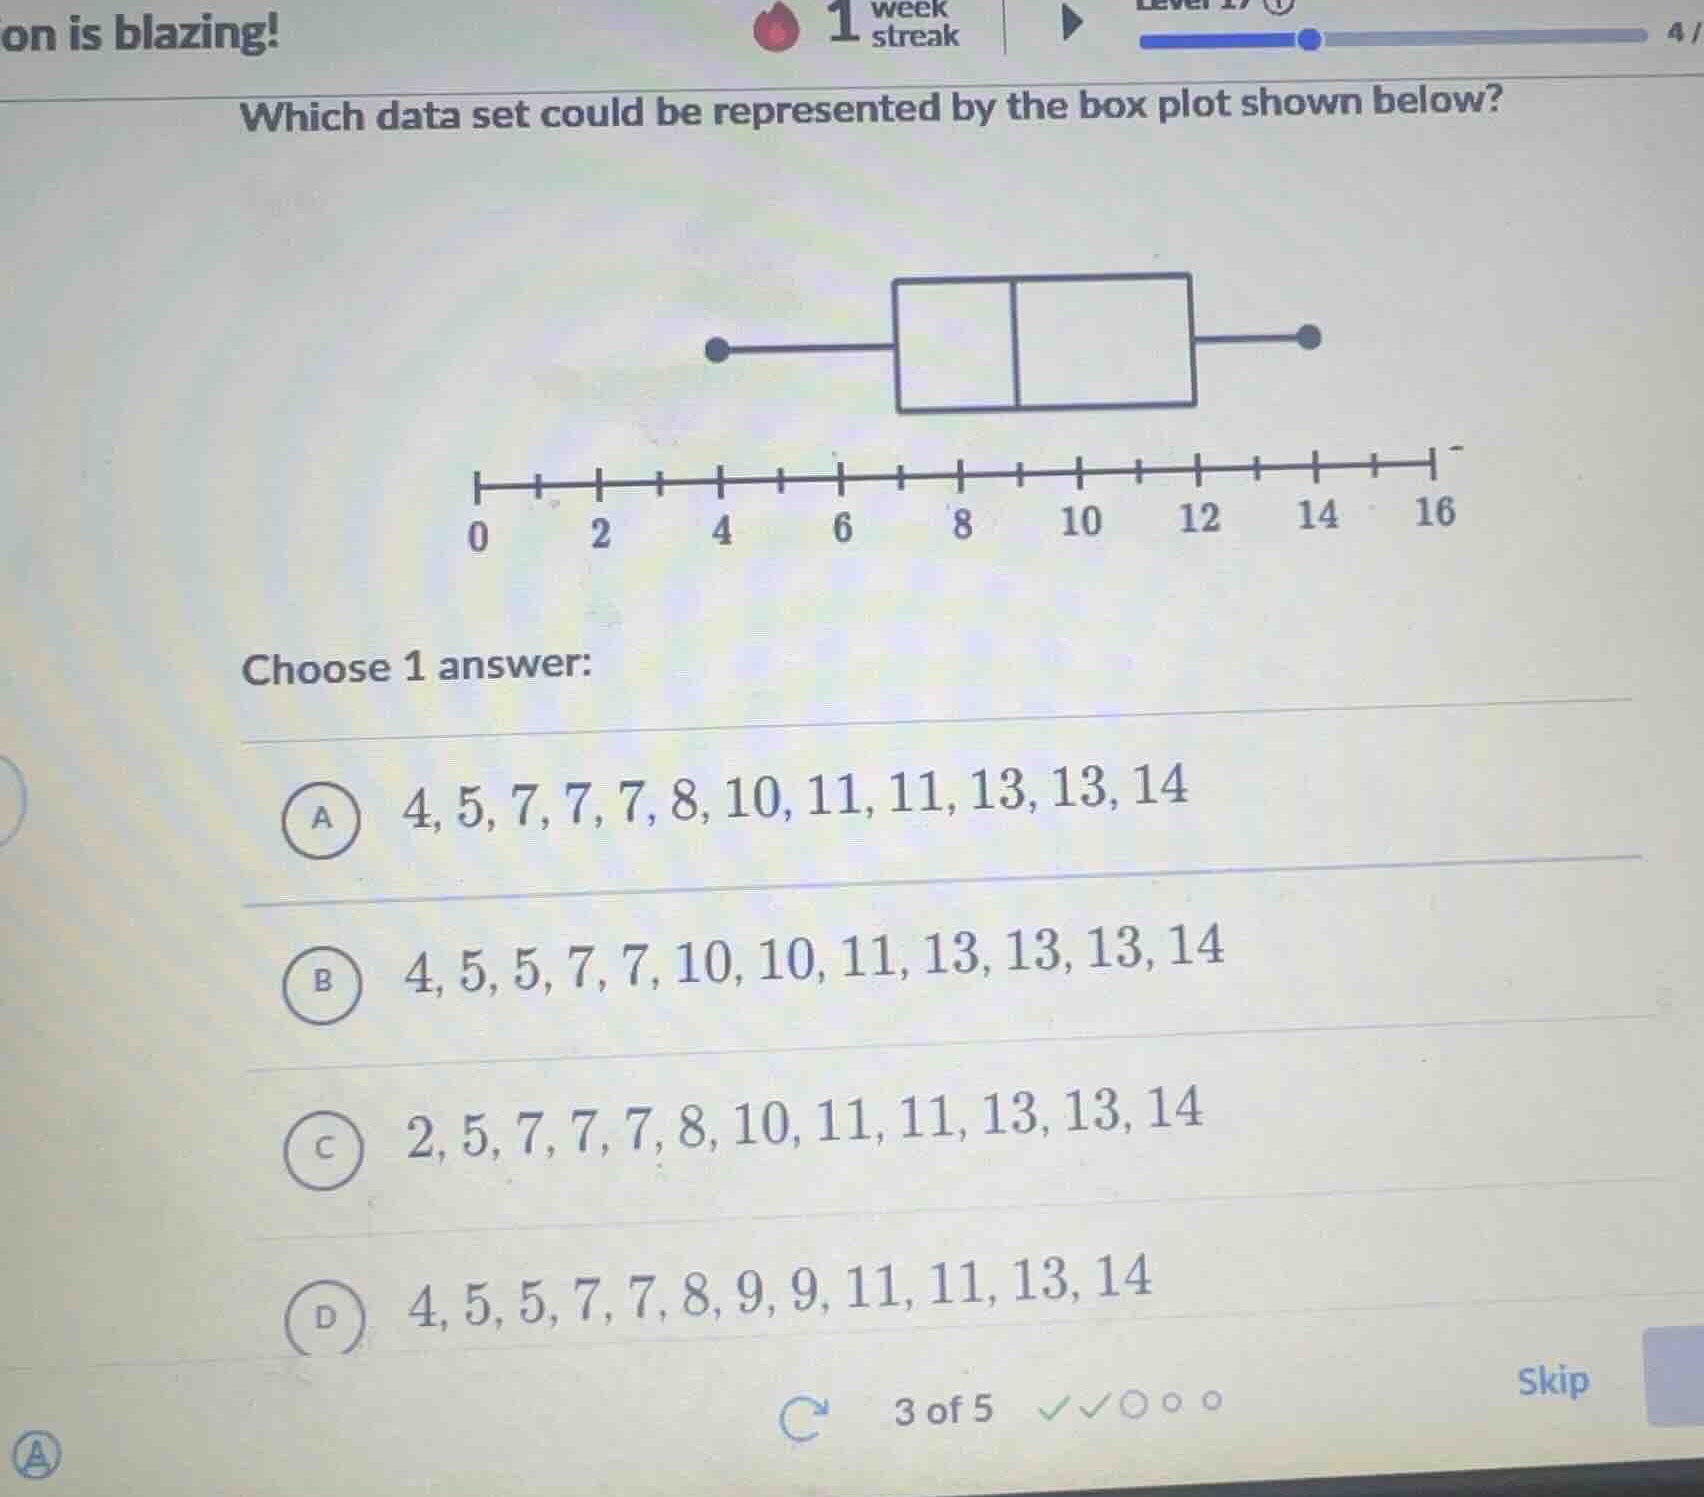
which data set could be represented by the box plot shown below? choose 1 answer: a 4,5,7,7,7,8,10,11,11,13,13,14 b 4,5,5,7,7,10,10,11,13,13,13,14 c 2,5,7,7,7,8,10,11,11,13,13,14 d 4,5,5,7,7,8,9,9,11,11,13,14
Step1: Analyze the box plot's minimum value
The box plot has a minimum value at 4 (the leftmost dot). So we can eliminate option C (which has a minimum of 2).
Step2: Analyze the median and quartiles
For a data set with 12 values (n = 12), the median is the average of the 6th and 7th values. Let's check each remaining option:
- Option A: Data set is 4, 5, 7, 7, 7, 8, 10, 11, 11, 13, 13, 14. 6th value is 8, 7th is 10. Median is (8 + 10)/2 = 9.
- Option B: Data set is 4, 5, 5, 7, 7, 10, 10, 11, 13, 13, 13, 14. 6th value is 10, 7th is 10. Median is (10 + 10)/2 = 10.
- Option D: Data set is 4, 5, 5, 7, 7, 8, 9, 9, 11, 11, 13, 14. 6th value is 8, 7th is 9. Median is (8 + 9)/2 = 8.5.
Looking at the box plot, the median seems to be around 9 - 10, and the lower quartile (Q1) and upper quartile (Q3) should match the box. Option A's data, when ordered, has a box that would match the plot's structure (min=4, Q1 around 7, median around 9, Q3 around 11 - 13, max=14). Option B has a higher median and different quartile structure, and Option D has a lower median.

Snap & solve any problem in the app
Get step-by-step solutions on Sovi AI
Photo-based solutions with guided steps
Explore more problems and detailed explanations
A. 4, 5, 7, 7, 7, 8, 10, 11, 11, 13, 13, 14