QUESTION IMAGE
Question
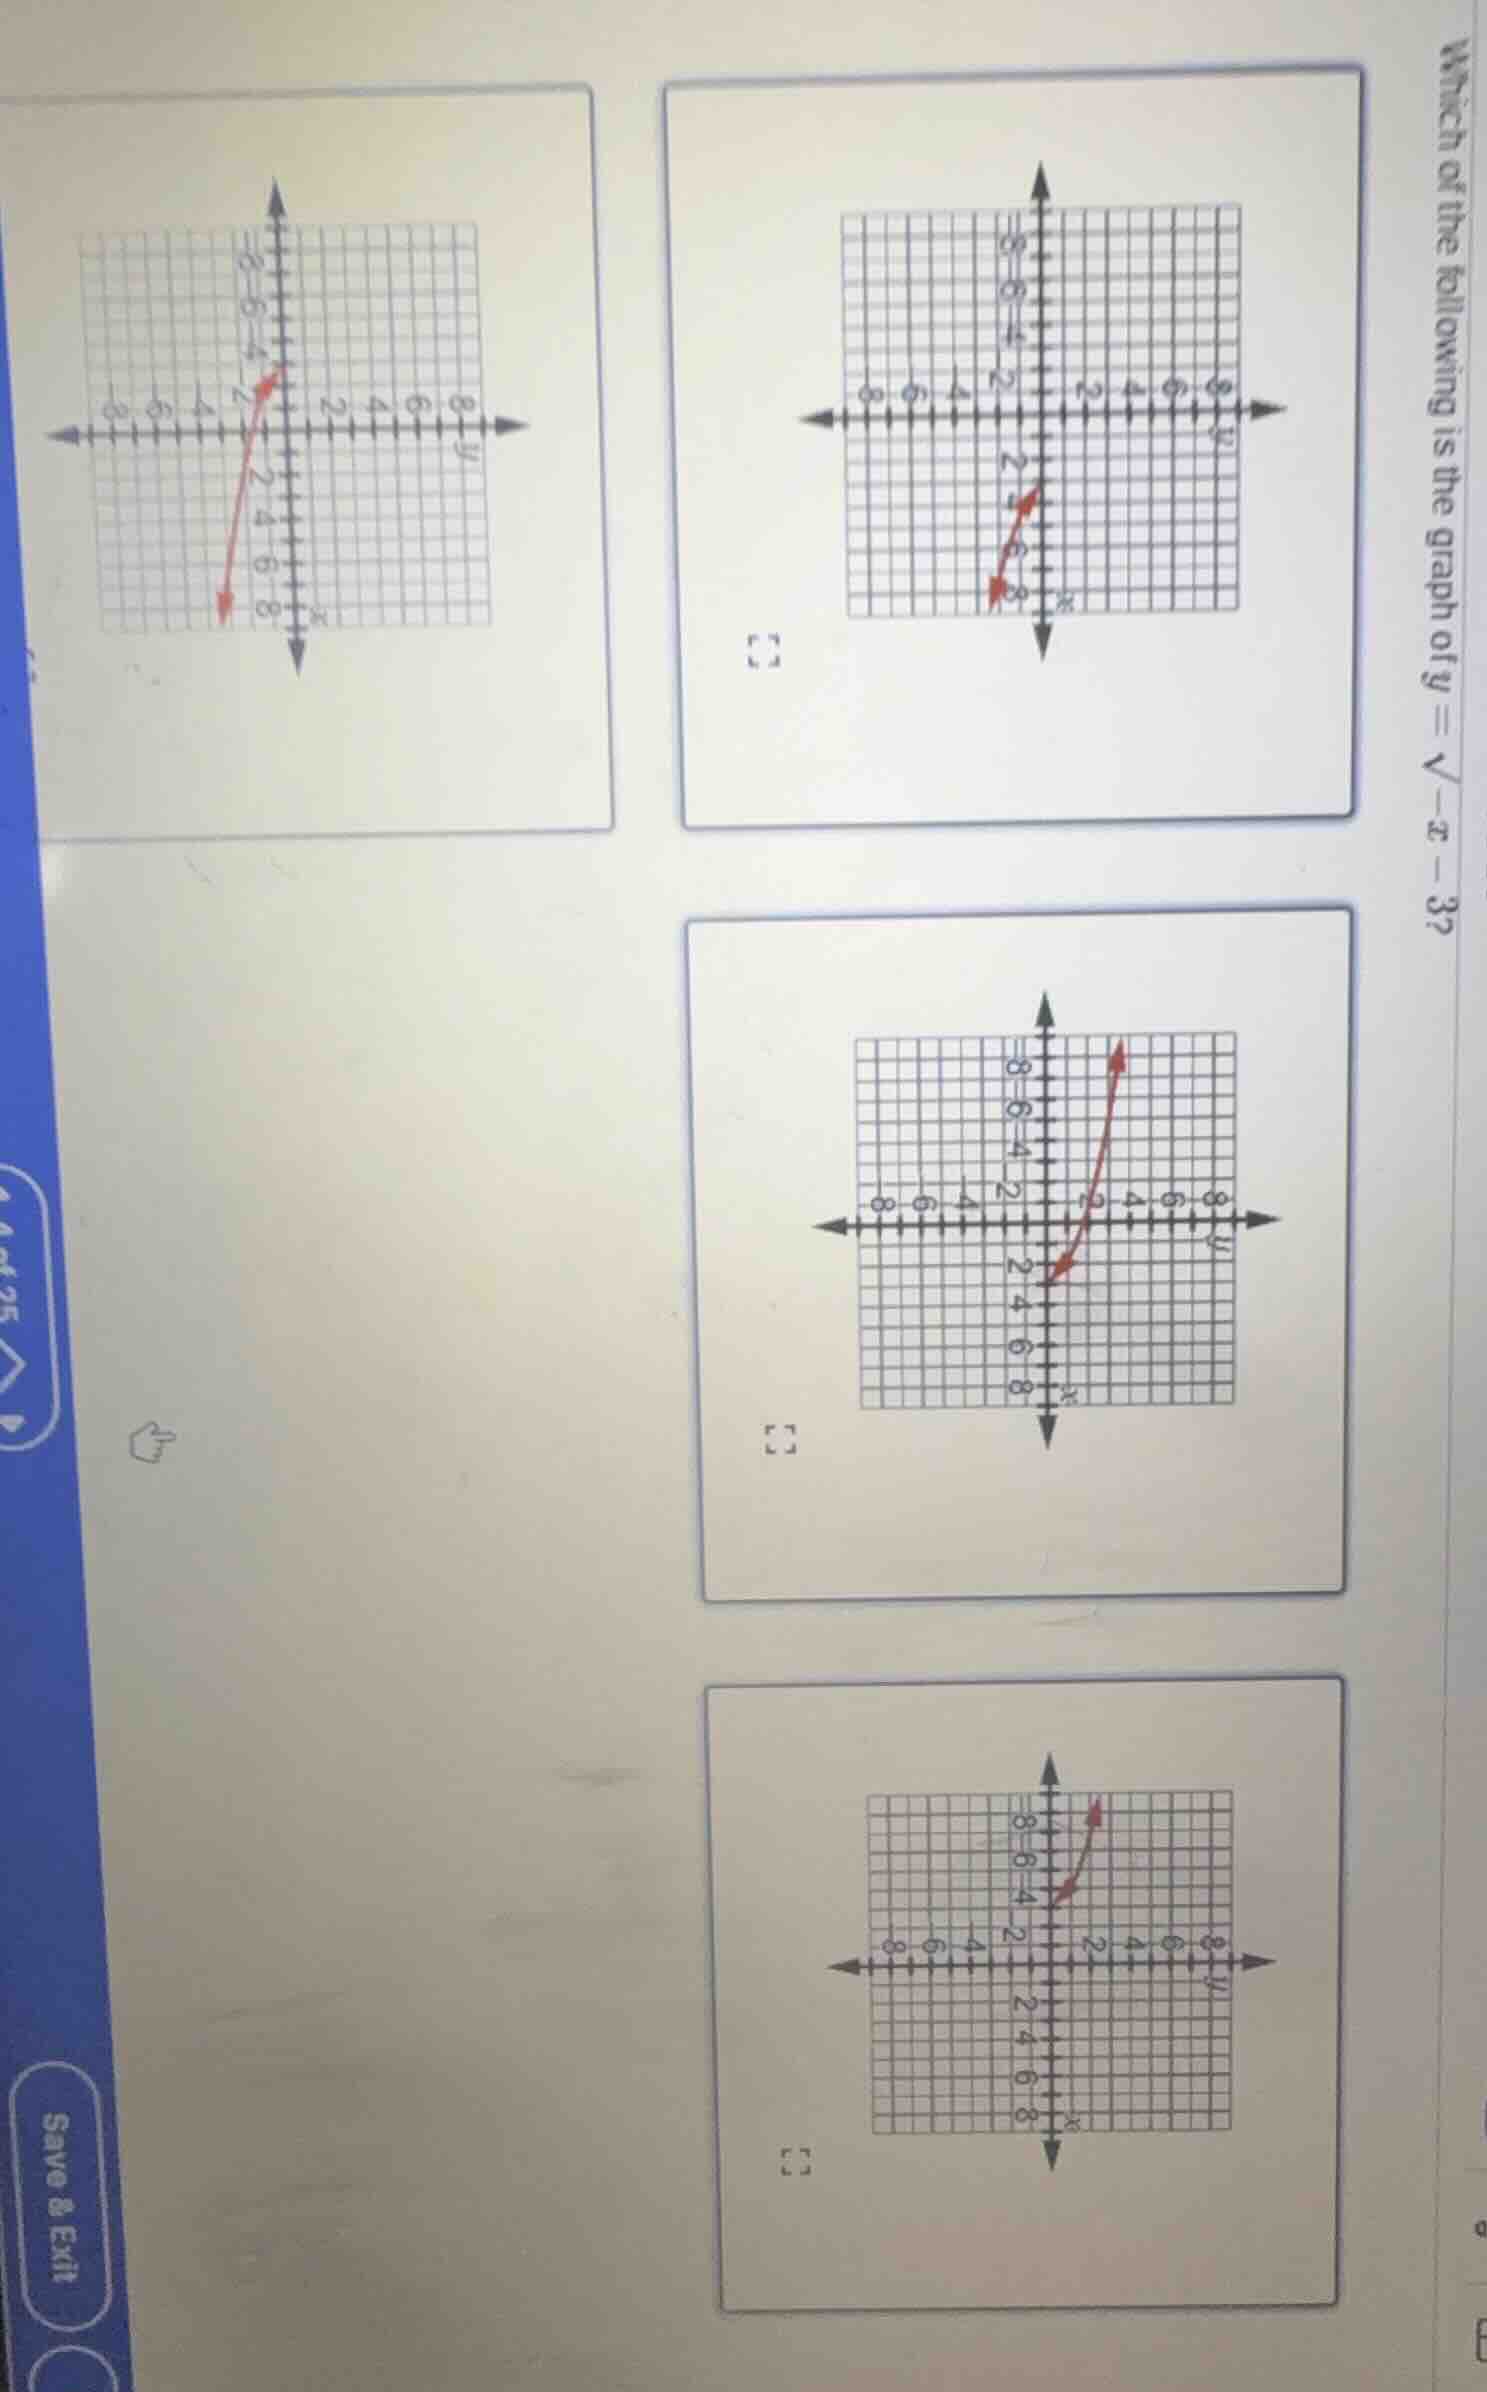
which of the following is the graph of $y = \sqrt{-x} - 3$?
Step1: Analyze the domain of the function
For the function \( y = \sqrt{-x - 3} \), the expression inside the square root must be non - negative. So we set up the inequality:
\( -x - 3\geq0 \)
To solve for \( x \), we first add \( x \) to both sides:
\( - 3\geq x \) or \( x\leq - 3 \)
This means that the graph of the function should only exist for \( x\leq - 3 \).
Step2: Analyze the range of the function
Since the square root of a non - negative number is always non - negative, \( y=\sqrt{-x - 3}\geq0 \).
Step3: Analyze the shape and key points
Let's find the vertex (the starting point of the square - root graph). When \( y = 0 \), we have:
\( 0=\sqrt{-x - 3} \)
Squaring both sides (since both sides are non - negative), we get \( 0=-x - 3 \), so \( x=-3 \). So the vertex of the graph is at \( (-3,0) \).
As \( x \) decreases (since \( x\leq - 3 \)), \( -x - 3 \) increases, and \( y=\sqrt{-x - 3} \) also increases. So the graph should start at \( (-3,0) \) and move to the left (as \( x \) becomes more negative) while \( y \) increases.
Now let's analyze the given graphs:
- The first graph (top - left) has a linear appearance, but our function is a square - root function, so it should be a curve.
- The second graph (top - right) has a domain that seems to be for \( x\) values greater than some positive number (from the visual), which does not match \( x\leq - 3 \).
- The third graph (middle - right) has a domain of \( x\geq0 \) (from the visual), which does not match \( x\leq - 3 \).
- The fourth graph (bottom - right) has a vertex at \( (-3,0) \) (or a point that is consistent with \( x = - 3,y = 0 \)) and the curve moves to the left (as \( x \) decreases) with \( y \) increasing, and the domain \( x\leq - 3 \) and range \( y\geq0 \) are satisfied.

Snap & solve any problem in the app
Get step-by-step solutions on Sovi AI
Photo-based solutions with guided steps
Explore more problems and detailed explanations
The graph that represents \( y=\sqrt{-x - 3} \) is the bottom - right graph (the fourth graph in the given set of graphs).