QUESTION IMAGE
Question
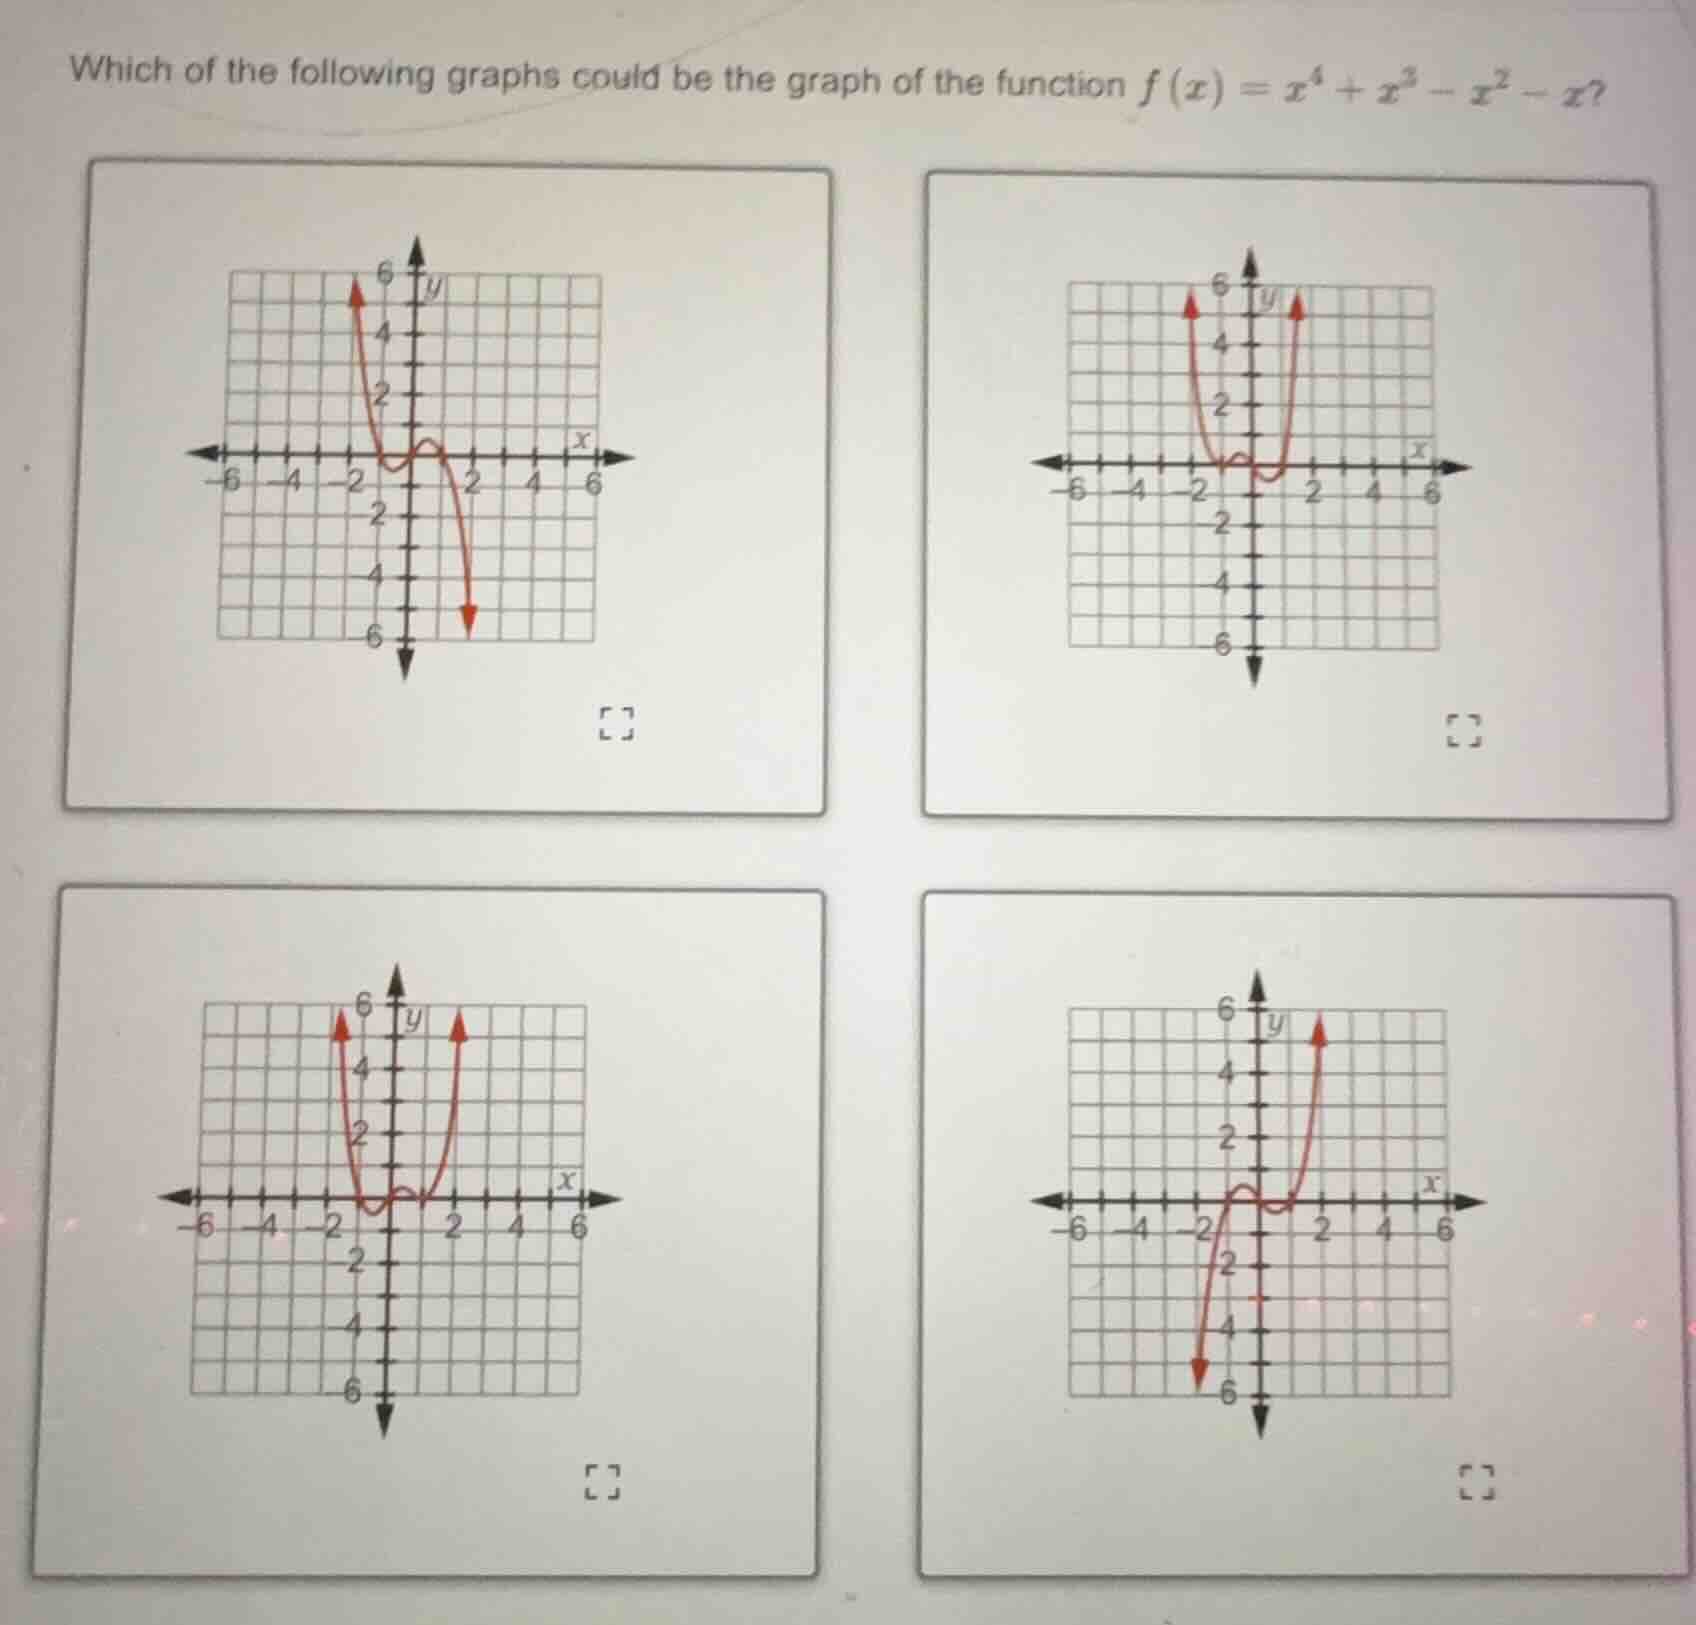
which of the following graphs could be the graph of the function $f(x)=x^4 + x^3 - x^2 - x$?
Step1: Analyze the leading term
The function is \( f(x) = x^4 + x^3 - x^2 - x \). The leading term is \( x^4 \), which has a positive coefficient. For even - degree polynomials with a positive leading coefficient, as \( x\to\pm\infty \), \( f(x)\to+\infty \). So we can eliminate the graphs where the ends of the graph go to \( -\infty \) (the first and the fourth graphs, since their right - hand or left - hand ends go down).
Step2: Factor the function
Factor the function \( f(x)=x^4 + x^3 - x^2 - x \). First, group the terms:
\( f(x)=(x^4 + x^3)-(x^2 + x) \)
Factor out the common factors from each group:
\( f(x)=x^3(x + 1)-x(x + 1) \)
Then factor out \( (x + 1) \):
\( f(x)=(x + 1)(x^3 - x) \)
Factor \( x^3 - x \) further: \( x^3 - x=x(x^2 - 1)=x(x - 1)(x + 1) \)
So \( f(x)=(x + 1)^2x(x - 1) \)
Step3: Find the x - intercepts
Set \( f(x) = 0 \), then \( (x + 1)^2x(x - 1)=0 \). The solutions are \( x=-1 \) (with multiplicity 2), \( x = 0 \), and \( x = 1 \).
Step4: Analyze the behavior at x - intercepts
- At \( x=-1 \) (multiplicity 2), the graph touches the x - axis and turns around (since the multiplicity is even).
- At \( x = 0 \) and \( x = 1 \) (multiplicity 1), the graph crosses the x - axis.
Now let's analyze the remaining graphs (the second and the third):
- The second graph: Let's check the y - intercept. When \( x = 0 \), \( f(0)=0^4+0^3 - 0^2 - 0 = 0 \). But the second graph seems to have a non - zero y - intercept (it looks like it touches the x - axis at non - zero points and has a minimum above the x - axis near the origin), which does not match.
- The third graph: It has x - intercepts at \( x=-1 \) (touches the axis), \( x = 0 \) (crosses), and \( x = 1 \) (crosses), and as \( x\to\pm\infty \), \( y\to+\infty \), which matches our analysis.

Snap & solve any problem in the app
Get step-by-step solutions on Sovi AI
Photo-based solutions with guided steps
Explore more problems and detailed explanations
The third graph (the one in the bottom - left among the four given graphs)