QUESTION IMAGE
Question
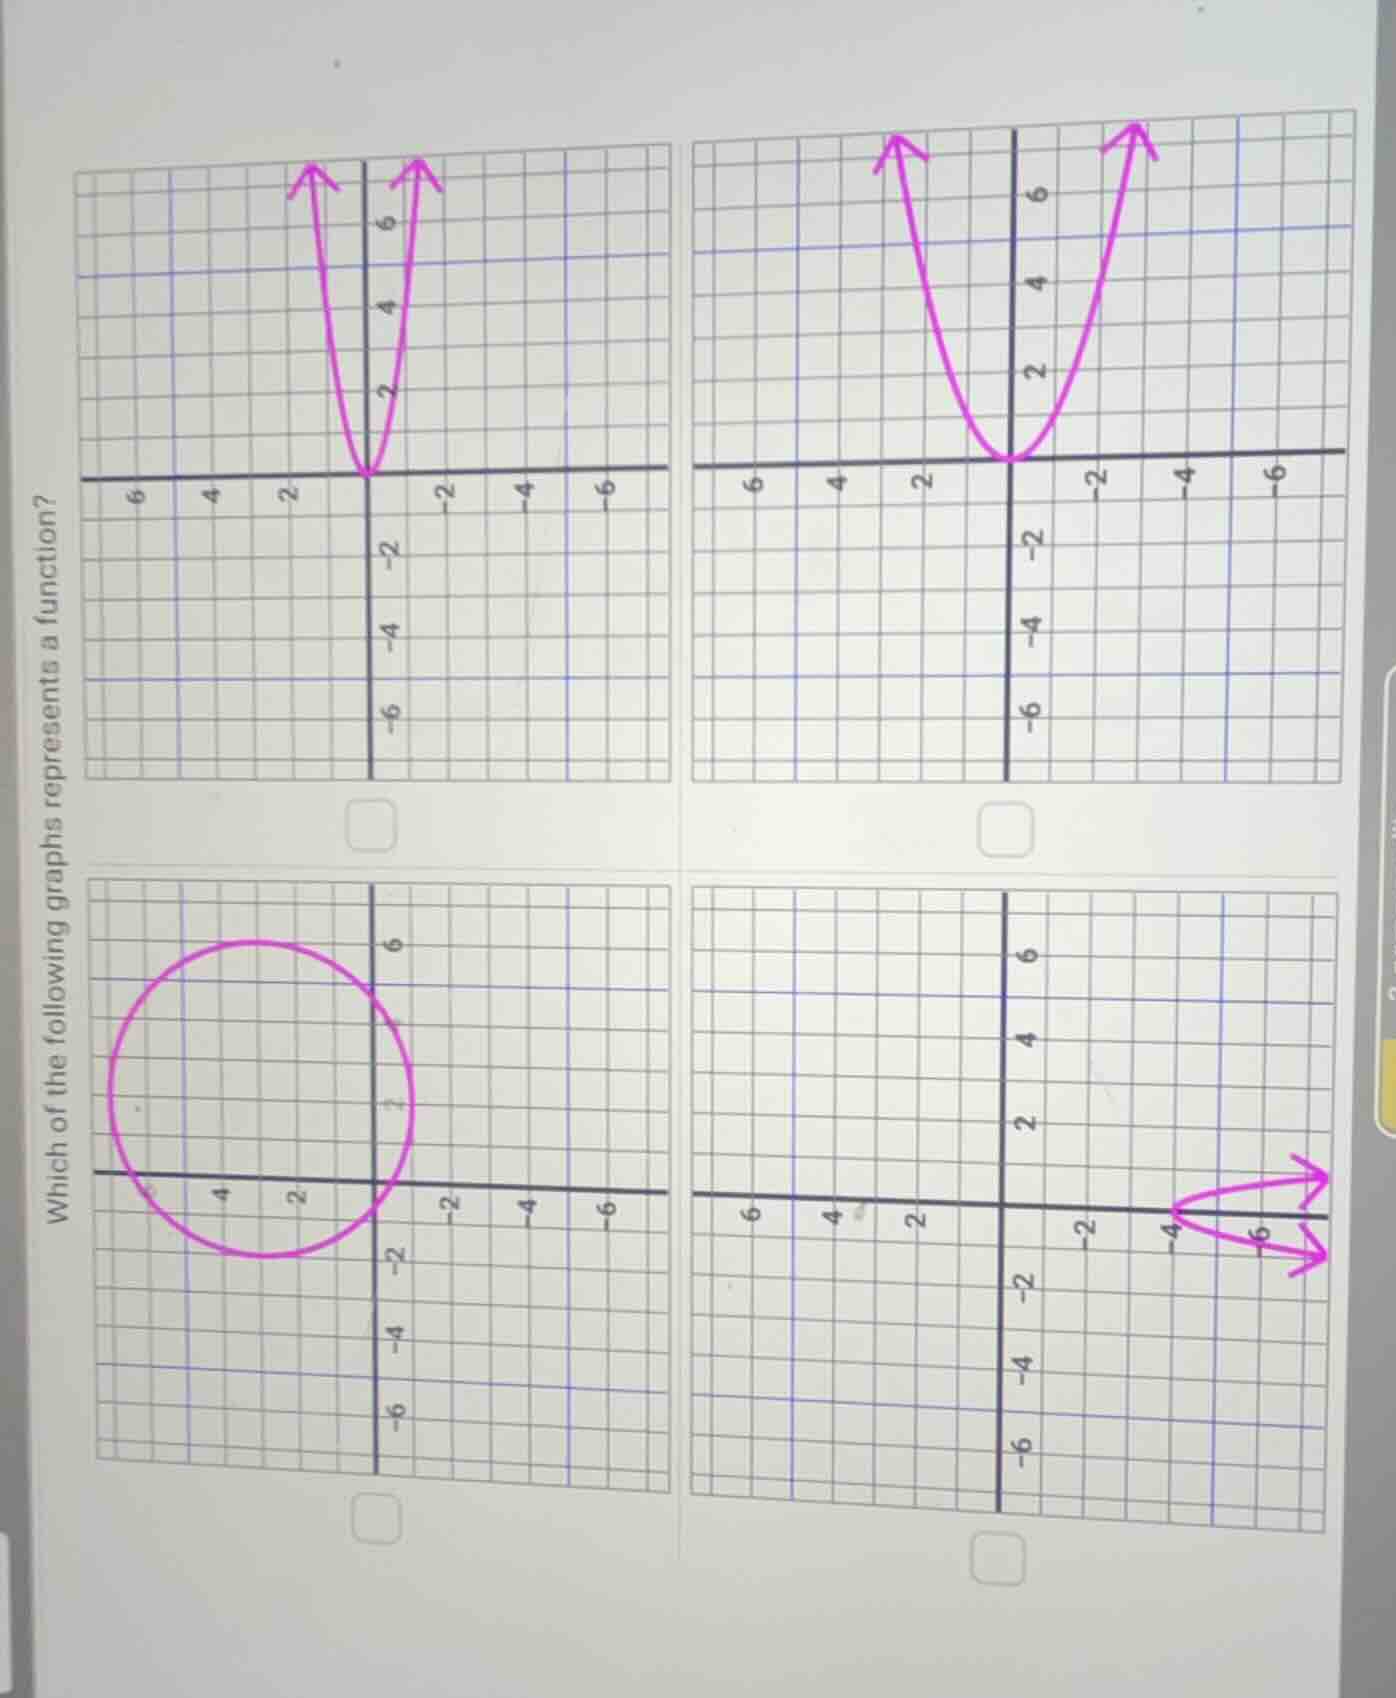
which of the following graphs represents a function?
Brief Explanations
A graph represents a function if it passes the Vertical Line Test: any vertical line drawn on the graph intersects it at most once.
- Top-left graph: All vertical lines intersect at 1 point. Passes test.
- Top-right graph: All vertical lines intersect at 1 point. Passes test.
- Bottom-left circle: A vertical line can intersect at 2 points. Fails test.
- Bottom-right graph: A vertical line can intersect at 2 points. Fails test.

Snap & solve any problem in the app
Get step-by-step solutions on Sovi AI
Photo-based solutions with guided steps
Explore more problems and detailed explanations
The top-left parabola graph and the top-right parabola graph represent functions.