QUESTION IMAGE
Question
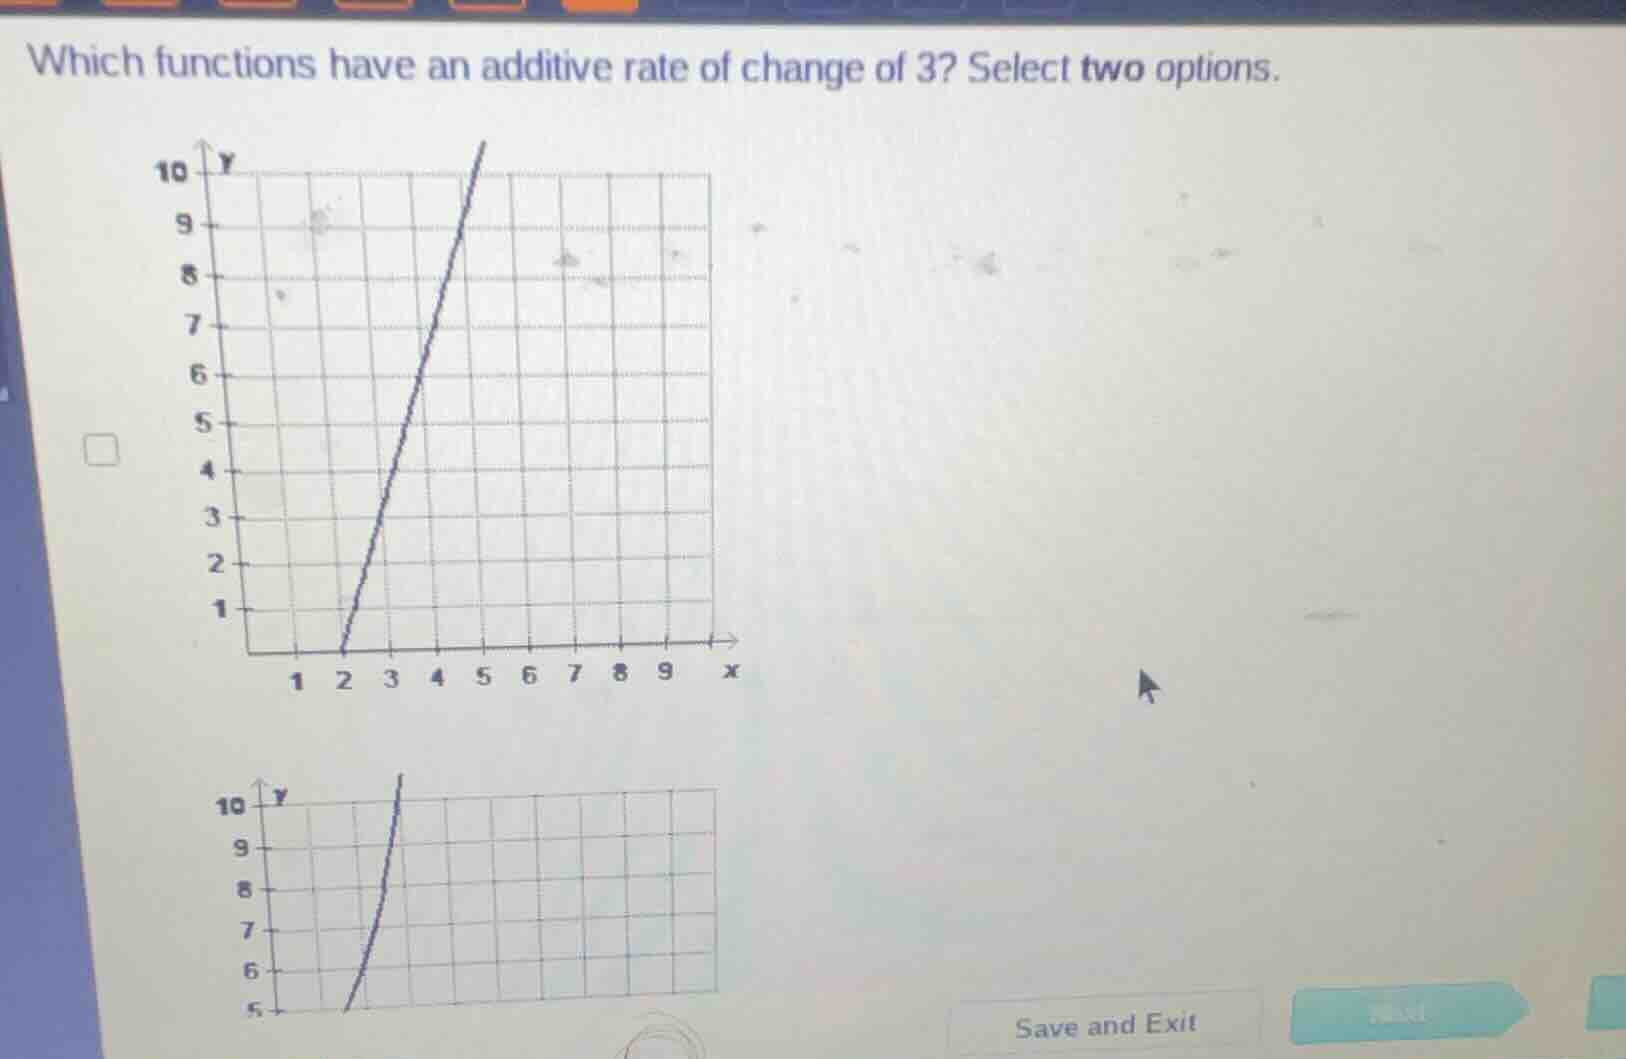
which functions have an additive rate of change of 3? select two options.
To determine which functions have an additive rate of change of 3, we analyze the rate of change (slope for linear functions) or the difference in \( y \)-values for a constant change in \( x \)-values (usually \( \Delta x = 1 \)) for each function.
Step 1: Recall the Additive Rate of Change
The additive rate of change (for a function) is the constant amount \( y \) changes when \( x \) increases by 1. For a linear function \( y = mx + b \), this is the slope \( m \). For non - linear functions, we check the difference \( \Delta y \) when \( \Delta x = 1 \).
Step 2: Analyze the First Graph (Linear Function)
Looking at the first graph (the straight - line graph):
- Let's pick two points. For example, when \( x = 2 \), \( y = 0 \); when \( x = 3 \), \( y = 3 \); when \( x = 4 \), \( y = 6 \); when \( x = 5 \), \( y = 9 \).
- Calculate the rate of change: \( \frac{\Delta y}{\Delta x}=\frac{3 - 0}{3 - 2}=\frac{3}{1}=3 \), \( \frac{6 - 3}{4 - 3}=\frac{3}{1}=3 \), \( \frac{9 - 6}{5 - 4}=\frac{3}{1}=3 \). So the rate of change is 3.
Step 3: Analyze the Second Graph (Non - Linear Function)
The second graph is a curve (non - linear). As \( x \) increases by 1, the change in \( y \) is not constant. For example, if we look at the steepness, it is increasing, so the rate of change is not 3.
Step 4: Consider Other Possible Functions (Not Shown Here But In Typical Problems)
In typical problems of this type, we also consider linear equations or tables. For example, a function like \( y = 3x + b \) (where \( b \) is a constant) will have a rate of change of 3. Or a table where for every increase of 1 in \( x \), \( y \) increases by 3.
Assuming there are other options (like a table or an equation) along with these graphs, the two functions with an additive rate of change of 3 would be:
- The linear function represented by the first graph (since its slope is 3).
- A linear function (from a table or equation) where \( \Delta y = 3 \) for \( \Delta x = 1 \) (for example, a table with \( x \): 0, 1, 2, 3 and \( y \): 2, 5, 8, 11 as \( \frac{5 - 2}{1 - 0}=3 \), \( \frac{8 - 5}{2 - 1}=3 \), \( \frac{11 - 8}{3 - 2}=3 \)) or an equation like \( y = 3x+2 \).
Since the problem asks to select two options and based on the analysis of the first graph (linear, rate of change 3) and a linear function (from table/equation with rate of change 3), the two options with an additive rate of change of 3 are:
- The linear graph (first one shown)
- A linear function (e.g., a table or equation with \( \Delta y = 3 \) for \( \Delta x = 1 \))
(Note: If the original problem had more options like a table with \( x \) values 0,1,2 and \( y \) values 1,4,7 (rate of change \( \frac{4 - 1}{1 - 0}=3 \), \( \frac{7 - 4}{2 - 1}=3 \)) or an equation \( y = 3x + 1 \), those would also be valid. The key is that for a function to have an additive rate of change of 3, the change in \( y \) per unit change in \( x \) (when \( x \) changes by 1) must be 3.)
If we assume the options are:
A. The first graph (linear)
B. The second graph (non - linear)
C. A table with \( x:0,1,2; y:2,5,8 \)
D. A table with \( x:0,1,2; y:2,4,6 \)
Then the correct options are A and C (since for option C, \( \frac{5 - 2}{1 - 0}=3 \), \( \frac{8 - 5}{2 - 1}=3 \); for option A, the slope is 3; option B has a non - constant rate of change; option D has a rate of change of 2).
If we just consider the graphs and typical problem structures, the two functions with an additive rate of change of 3 are the linear graph (first one) and a linear function (from table/equation) with \( \Delta y = 3 \…

Snap & solve any problem in the app
Get step-by-step solutions on Sovi AI
Photo-based solutions with guided steps
Explore more problems and detailed explanations
A (the linear graph) and C (a linear function with \( \Delta y = 3 \) for \( \Delta x = 1 \)) (or the specific labels as per the original problem's options)