QUESTION IMAGE
Question
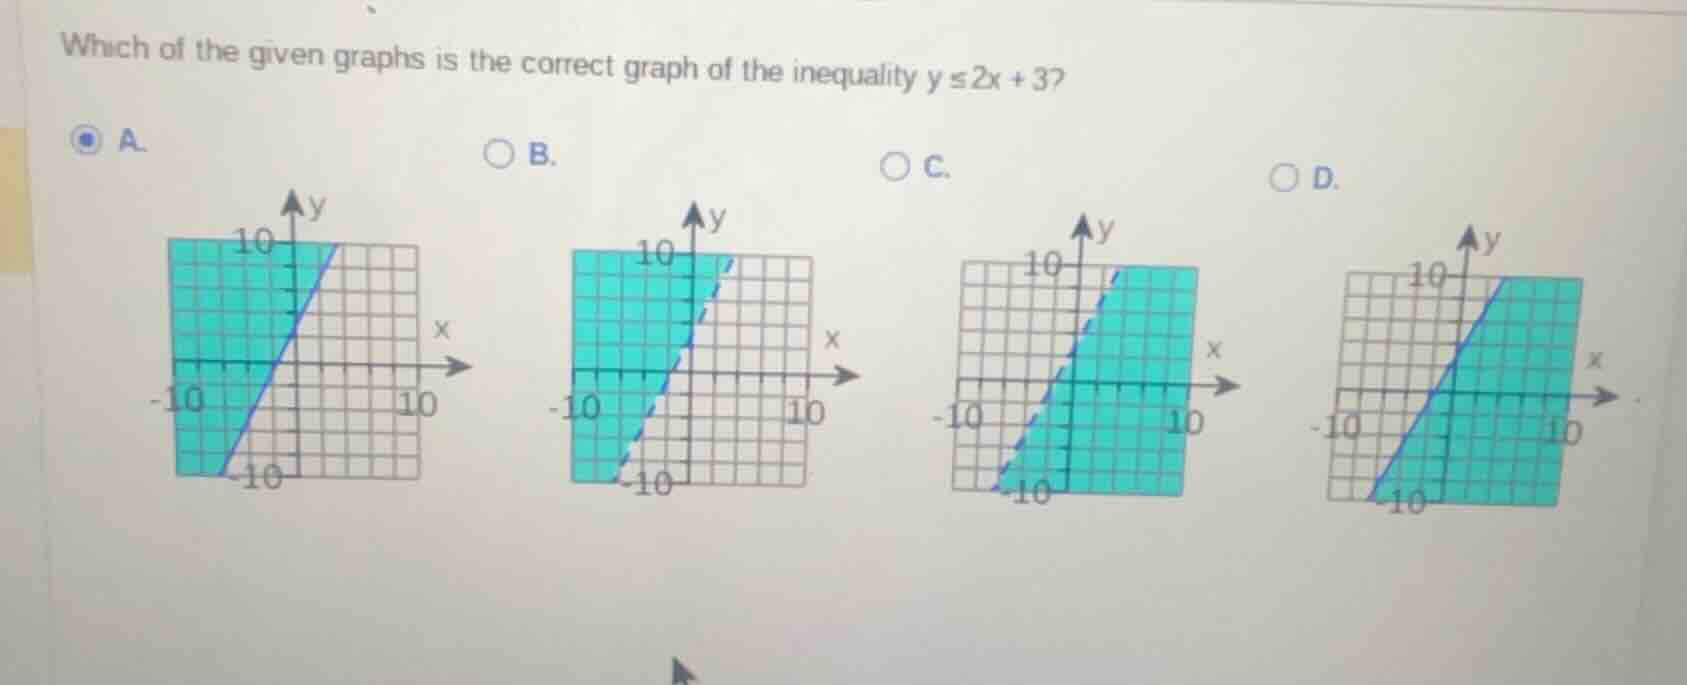
which of the given graphs is the correct graph of the inequality $y \leq 2x + 3$? \
\bigcirc a.\
\bigcirc b.\
\bigcirc c.\
\bigcirc d.
Step1: Analyze the inequality \( y \leq 2x + 3 \)
The inequality is a linear inequality. First, consider the boundary line \( y = 2x + 3 \). The slope \( m = 2 \) and the y - intercept \( b = 3 \). Since the inequality is \( y \leq 2x + 3 \), the boundary line should be solid (because of the "less than or equal to" sign) and we shade the region below the line.
Step2: Check the y - intercept
For the line \( y = 2x+3 \), when \( x = 0 \), \( y=3 \). So the line should pass through \( (0,3) \). Now let's analyze the options:
- Option A: The line seems to pass through \( (0,0) \) (incorrect y - intercept), so A is wrong.
- Option B: The line is dashed (but our inequality has \( \leq \), so the line should be solid), so B is wrong.
- Option C: The shading is above the line (but we need shading below \( y = 2x + 3 \)), so C is wrong.
- Option D: The line is solid (correct for \( \leq \)), passes through \( (0,3) \) (correct y - intercept), and the shading is below the line (correct for \( y \leq 2x + 3 \)).

Snap & solve any problem in the app
Get step-by-step solutions on Sovi AI
Photo-based solutions with guided steps
Explore more problems and detailed explanations
D. (The graph with a solid line \( y = 2x + 3 \) and shading below the line)