QUESTION IMAGE
Question
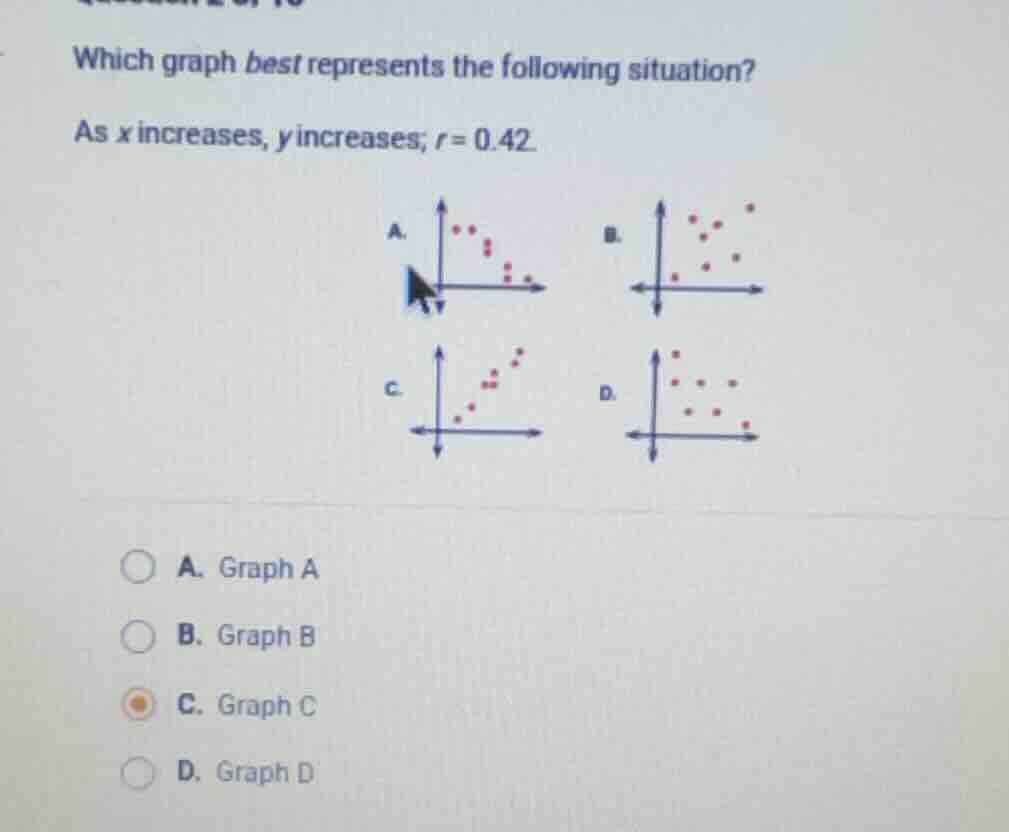
which graph best represents the following situation?
as x increases, y increases; $r = 0.42$
a.
b.
c.
d.
a. graph a
b. graph b
c. graph c
d. graph d
Brief Explanations
- The correlation coefficient \(r = 0.42\) is positive, so as \(x\) increases, \(y\) should increase (this eliminates Graph A and D, which show negative trends).
- An \(r\) value of 0.42 indicates a weak to moderate positive linear relationship. Graph C shows a strong tight positive trend, while Graph B shows a looser, more scattered positive trend that matches a moderate \(r\) value.

Snap & solve any problem in the app
Get step-by-step solutions on Sovi AI
Photo-based solutions with guided steps
Explore more problems and detailed explanations
B. Graph B