QUESTION IMAGE
Question
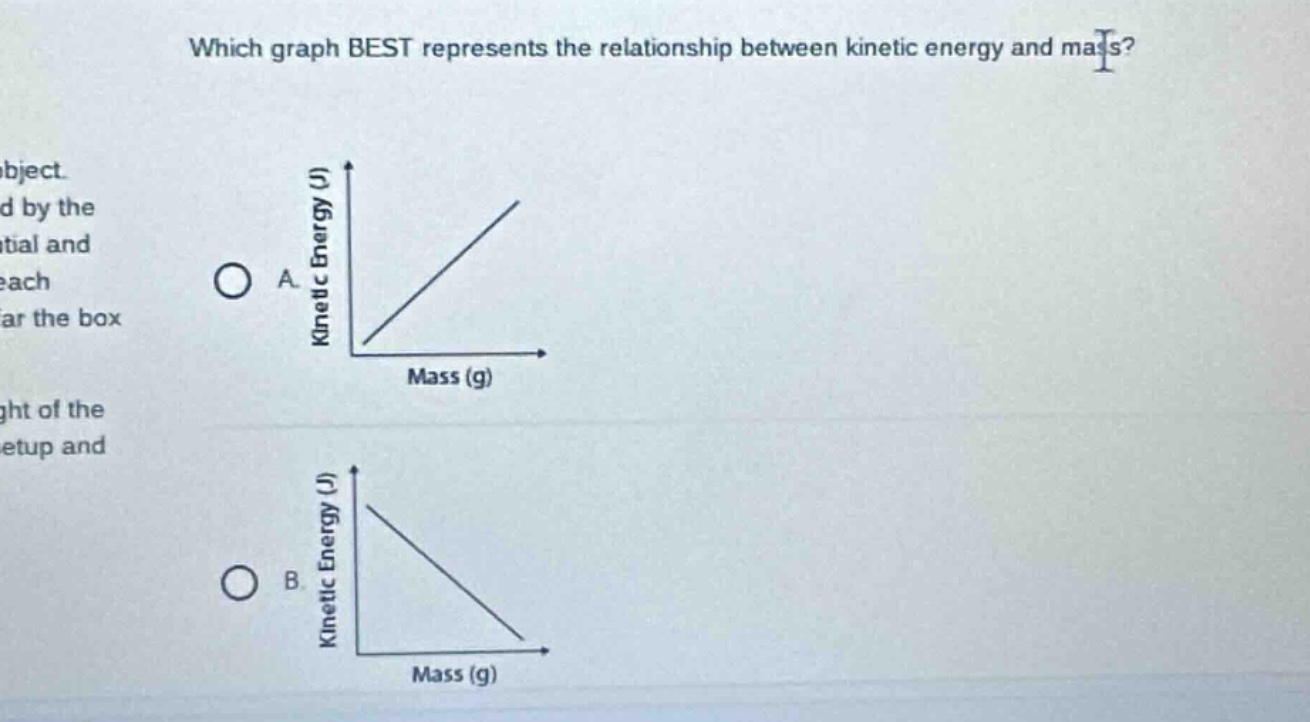
which graph best represents the relationship between kinetic energy and mass?
a. graph with kinetic energy (j) on y - axis, mass (g) on x - axis, a straight line starting from the origin and increasing
b. graph with kinetic energy (j) on y - axis, mass (g) on x - axis, a straight line starting from a point on the y - axis and decreasing to the x - axis
Step1: Recall Kinetic Energy Formula
The formula for kinetic energy is $KE = \frac{1}{2}mv^2$, where $m$ is mass and $v$ is velocity. Assuming velocity is constant, $KE$ is directly proportional to mass ($KE \propto m$ when $v$ is constant).
Step2: Analyze Graphs
- Graph A: Kinetic Energy increases linearly with mass (positive slope, passes through origin), consistent with $KE \propto m$.
- Graph B: Kinetic Energy decreases with mass (negative slope), which contradicts $KE = \frac{1}{2}mv^2$.

Snap & solve any problem in the app
Get step-by-step solutions on Sovi AI
Photo-based solutions with guided steps
Explore more problems and detailed explanations
A. The graph with Kinetic Energy (J) on y - axis, Mass (g) on x - axis, and a straight line from the origin with positive slope.