QUESTION IMAGE
Question
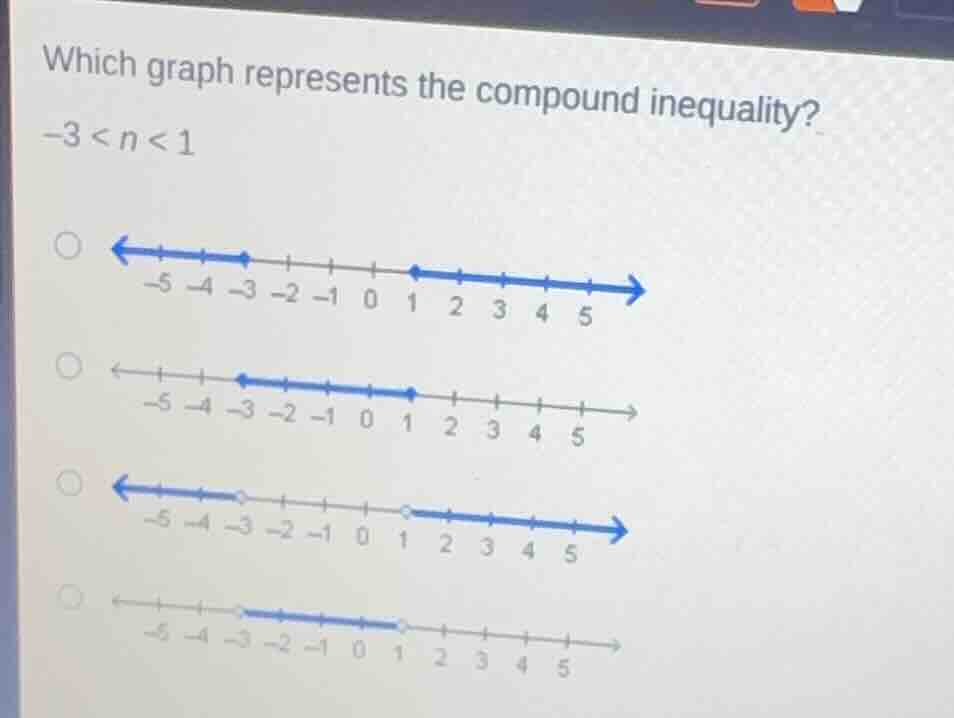
which graph represents the compound inequality?
-3 < n < 1
options with number lines (omitted image details as per instruction)
Step1: Analyze the inequality
The compound inequality is \(-3 < n < 1\). This means \(n\) is greater than \(-3\) and less than \(1\). On a number line, we use open circles (since the inequalities are strict, not including \(-3\) and \(1\)) and shade the region between \(-3\) and \(1\).
Step2: Evaluate each graph
- First graph: Two separate shaded regions, not between \(-3\) and \(1\). Eliminate.
- Second graph: Shaded from \(-3\) to \(1\) with closed circles, but our inequality is strict (no equal to), so closed circles are wrong. Eliminate.
- Third graph: Two separate shaded regions, not between \(-3\) and \(1\). Eliminate.
- Fourth graph: Open circles at \(-3\) and \(1\), shaded between them, which matches \(-3 < n < 1\).

Snap & solve any problem in the app
Get step-by-step solutions on Sovi AI
Photo-based solutions with guided steps
Explore more problems and detailed explanations
The fourth graph (the one with open circles at -3 and 1, and shading between them)