QUESTION IMAGE
Question
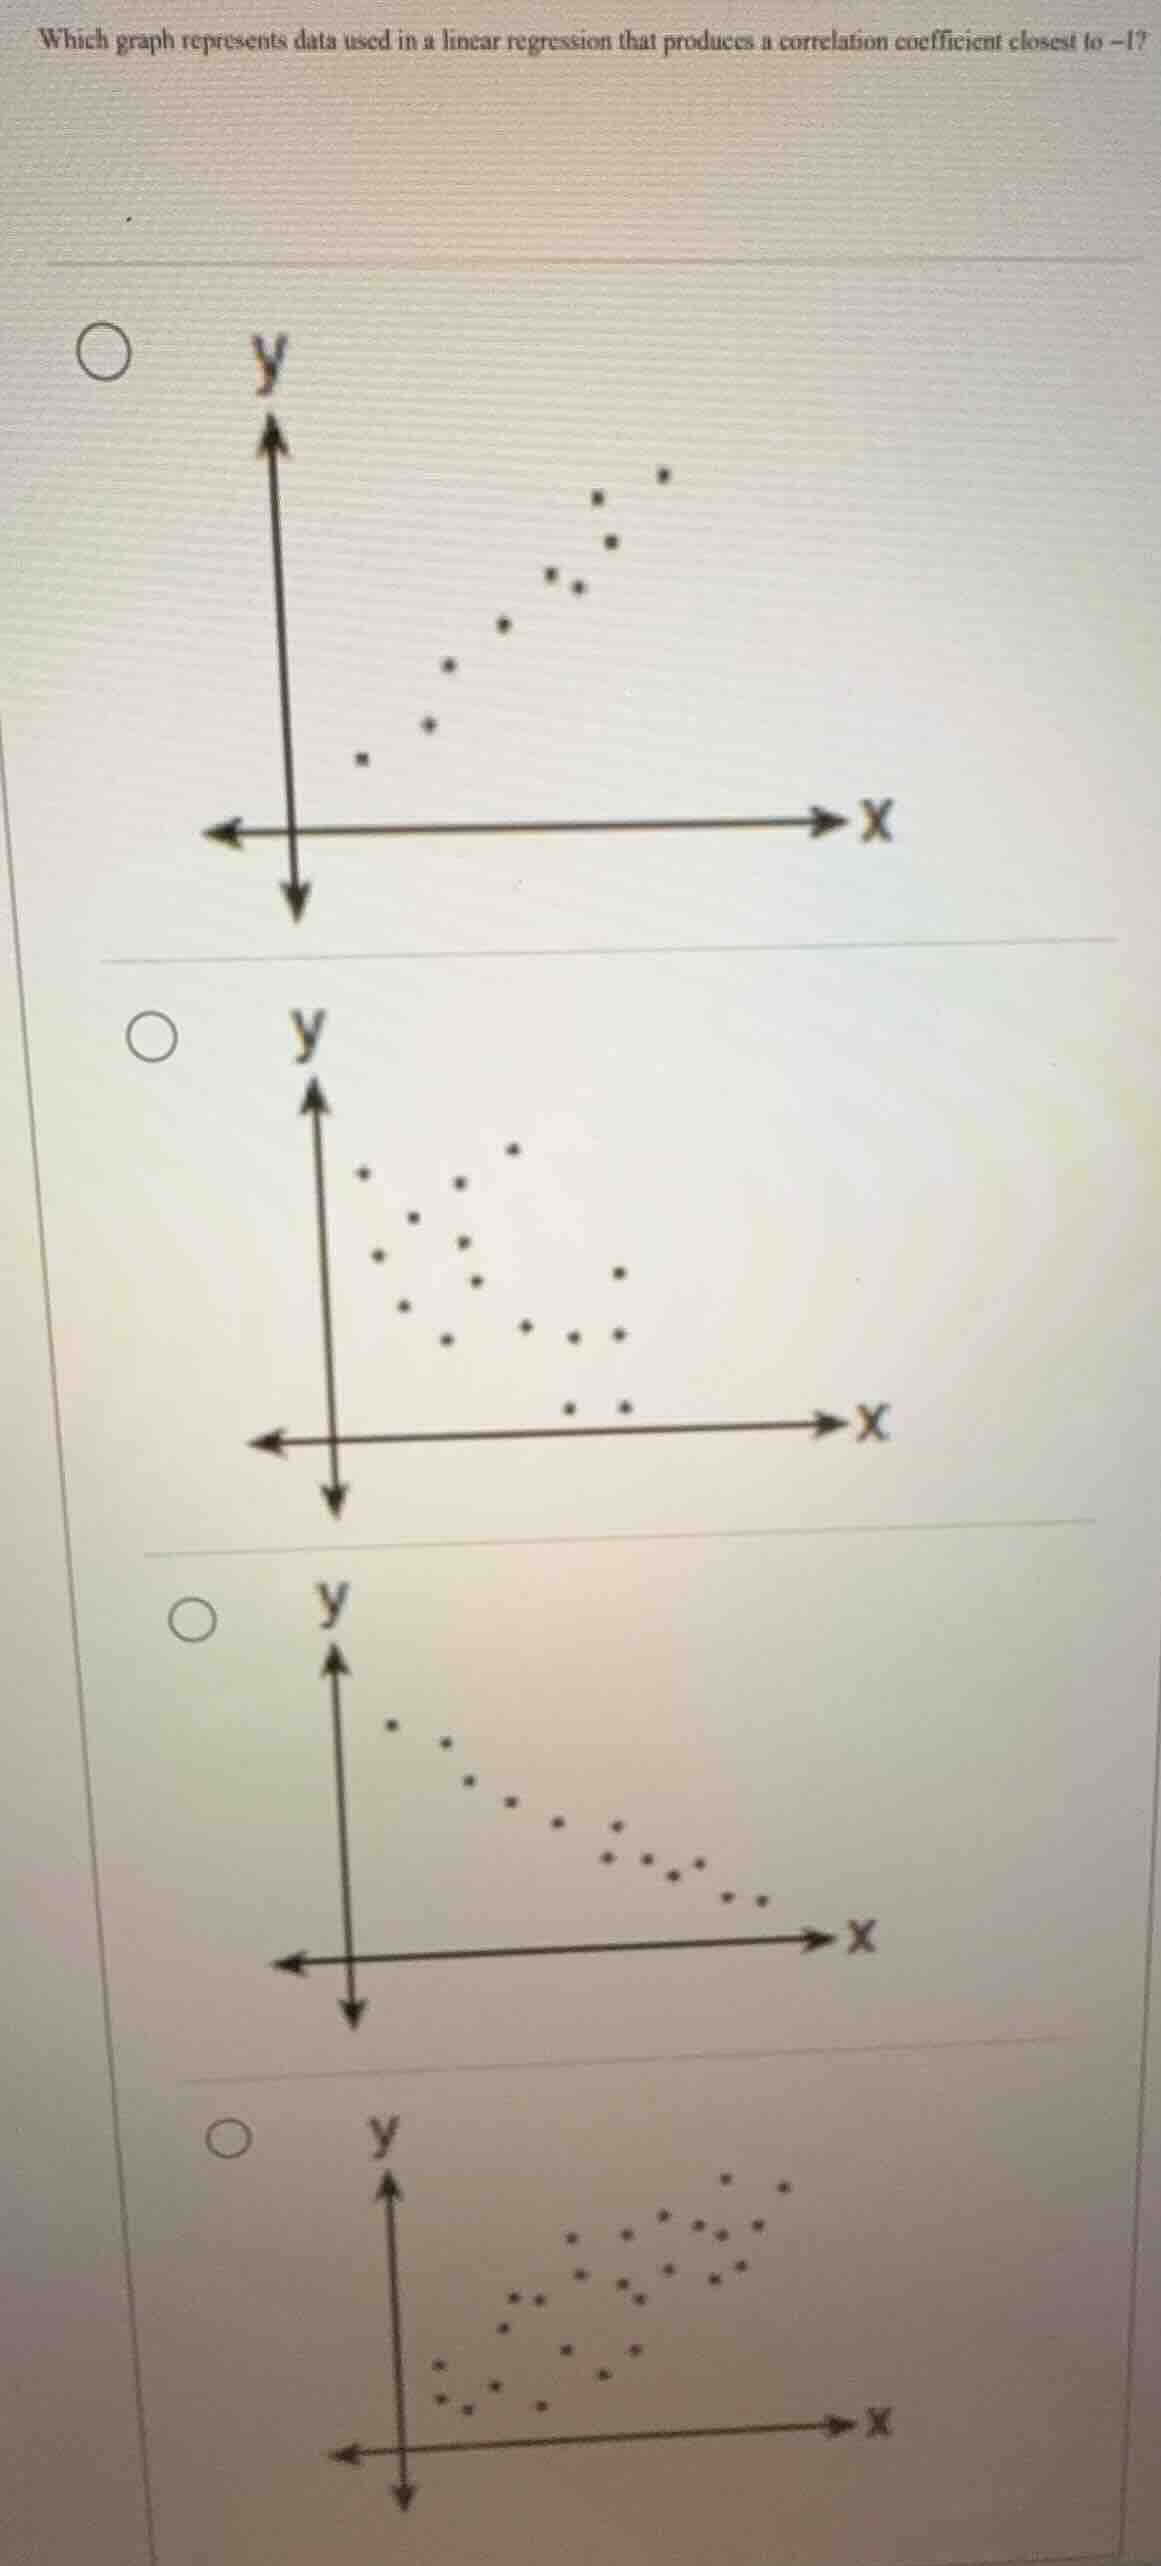
which graph represents data used in a linear regression that produces a correlation coefficient closest to -1? (followed by four scatter plot options with radio buttons)
Brief Explanations
A correlation coefficient of -1 means a perfect strong negative linear relationship: as x increases, y decreases, and data points lie nearly on a downward-sloping line.
- The first graph shows a positive upward trend (correlation close to +1).
- The second graph has no clear linear trend (correlation close to 0).
- The third graph shows a strong negative downward trend, with points tightly clustered along a downward slope, matching a correlation near -1.
- The fourth graph shows a positive upward trend with more scatter (correlation close to +1 but weaker than the first graph).

Snap & solve any problem in the app
Get step-by-step solutions on Sovi AI
Photo-based solutions with guided steps
Explore more problems and detailed explanations
The third scatter plot (the one with points decreasing from top-left to bottom-right in a tight linear pattern)