QUESTION IMAGE
Question
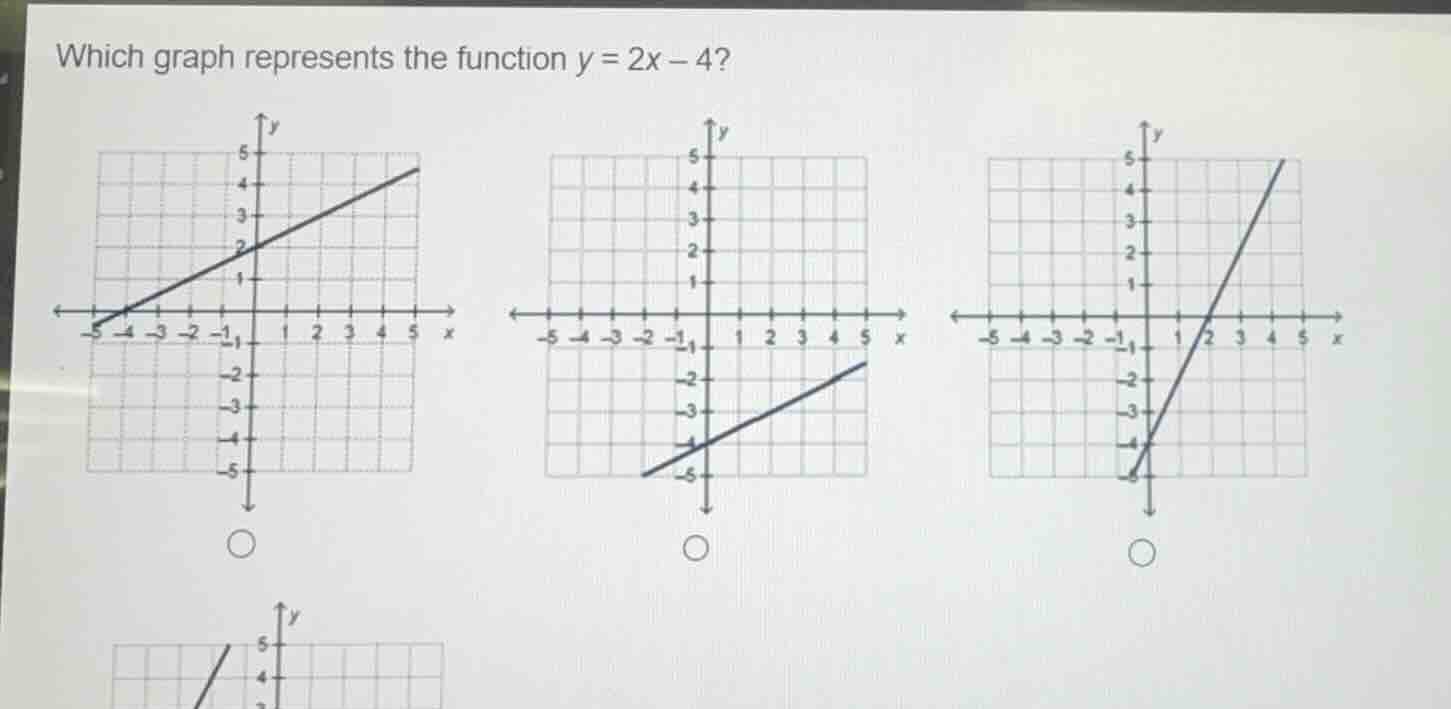
which graph represents the function $y = 2x - 4$?
Step1: Identify slope and y-intercept
The function $y=2x-4$ uses the slope-intercept form $y=mx+b$, where $m=2$ (slope) and $b=-4$ (y-intercept, the point $(0,-4)$).
Step2: Verify x-intercept
Set $y=0$ to find where the line crosses the x-axis:
$0=2x-4$
$2x=4$
$x=2$
So the line passes through $(2,0)$.
Step3: Match to the graph
Look for the line that goes through $(0,-4)$ and $(2,0)$ with a positive slope of 2 (rises 2 units for every 1 unit run right).

Snap & solve any problem in the app
Get step-by-step solutions on Sovi AI
Photo-based solutions with guided steps
Explore more problems and detailed explanations
The third graph (rightmost top graph, passing through $(0,-4)$ and $(2,0)$ with a steep positive slope)