QUESTION IMAGE
Question
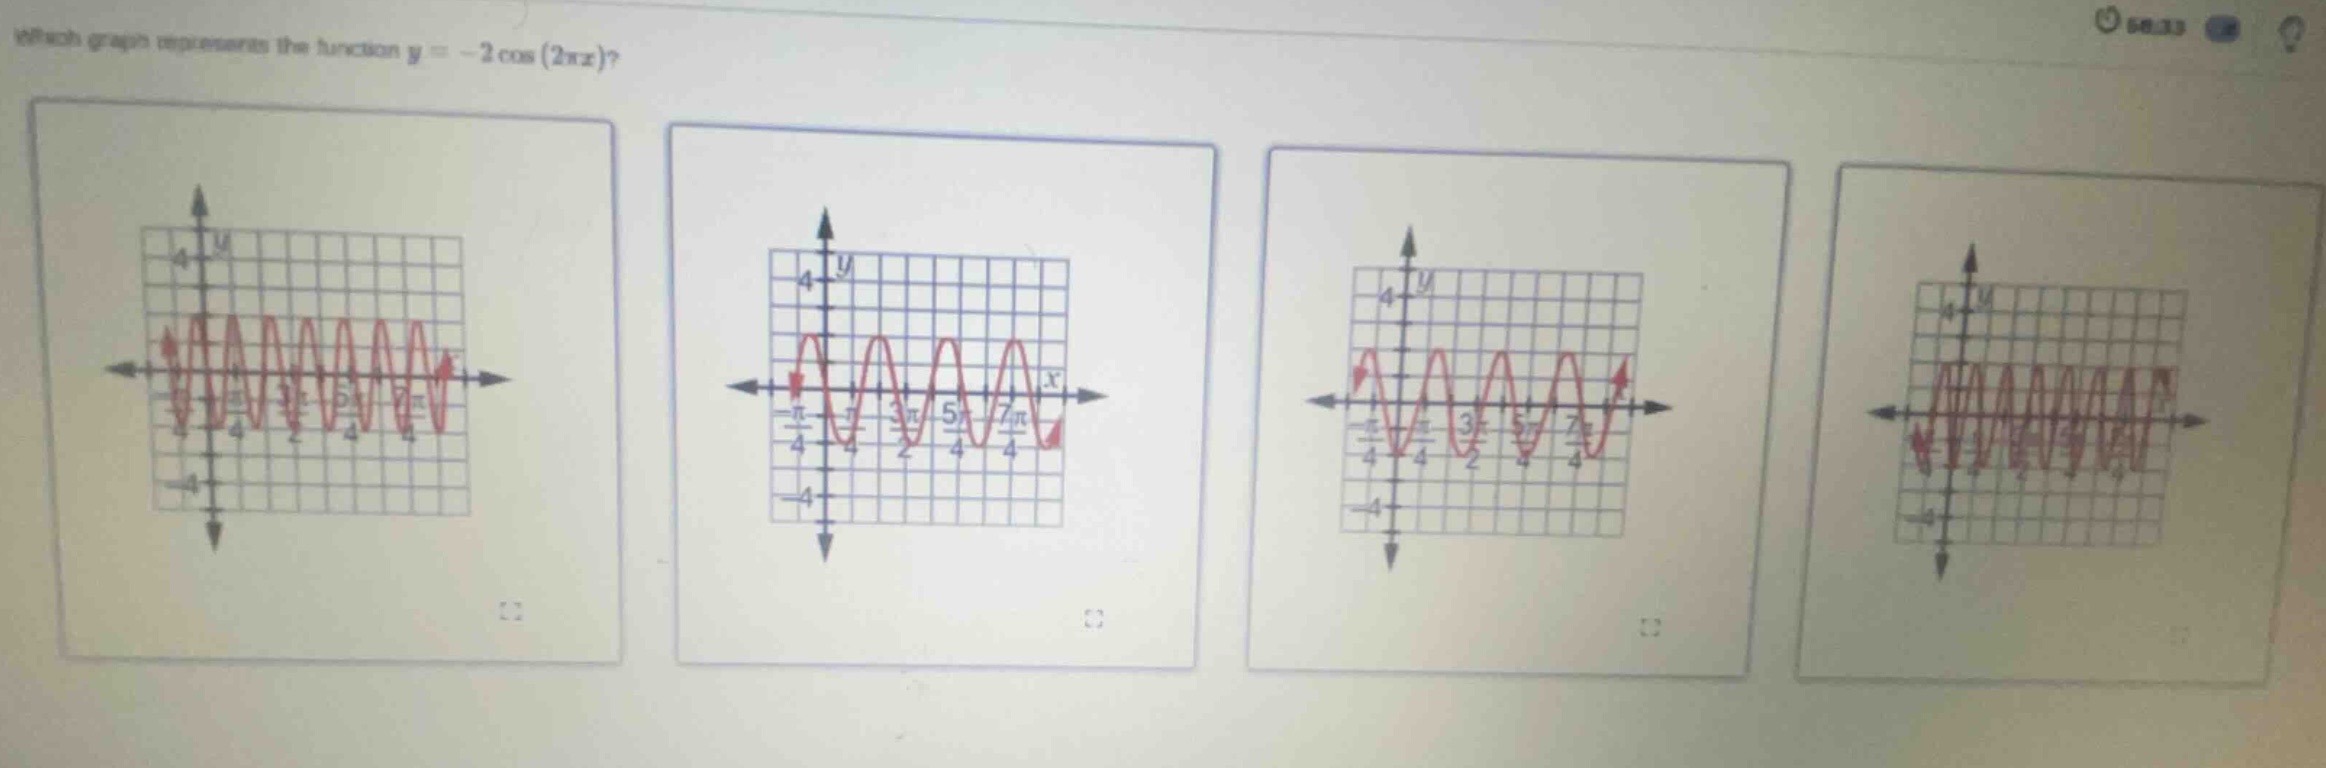
which graph represents the function $y = -2\cos(2\pi x)$?
Step1: Identify amplitude
The general form of a cosine function is $y = A\cos(Bx)$, where $|A|$ is the amplitude. For $y=-2\cos(2\pi x)$, $A=-2$, so amplitude $|A|=2$. This means the graph ranges between $y=2$ and $y=-2$, eliminating graphs with range outside this.
Step2: Calculate period
The period of $y=\cos(Bx)$ is $\frac{2\pi}{|B|}$. Here $B=2\pi$, so period $=\frac{2\pi}{2\pi}=1$. The graph completes one full cycle every 1 unit along the x-axis.
Step3: Check reflection & starting point
The negative sign in $A=-2$ reflects the cosine graph over the x-axis. The standard $\cos(0)=1$, so $-2\cos(0)=-2$. At $x=0$, the function value is $-2$, meaning the graph starts at $(0, -2)$ and oscillates with amplitude 2 and period 1.

Snap & solve any problem in the app
Get step-by-step solutions on Sovi AI
Photo-based solutions with guided steps
Explore more problems and detailed explanations
The third graph (left-to-right, bottom-right of the four) which has amplitude 2, period 1, starts at $(0,-2)$ and completes a full cycle every 1 x-unit.