QUESTION IMAGE
Question
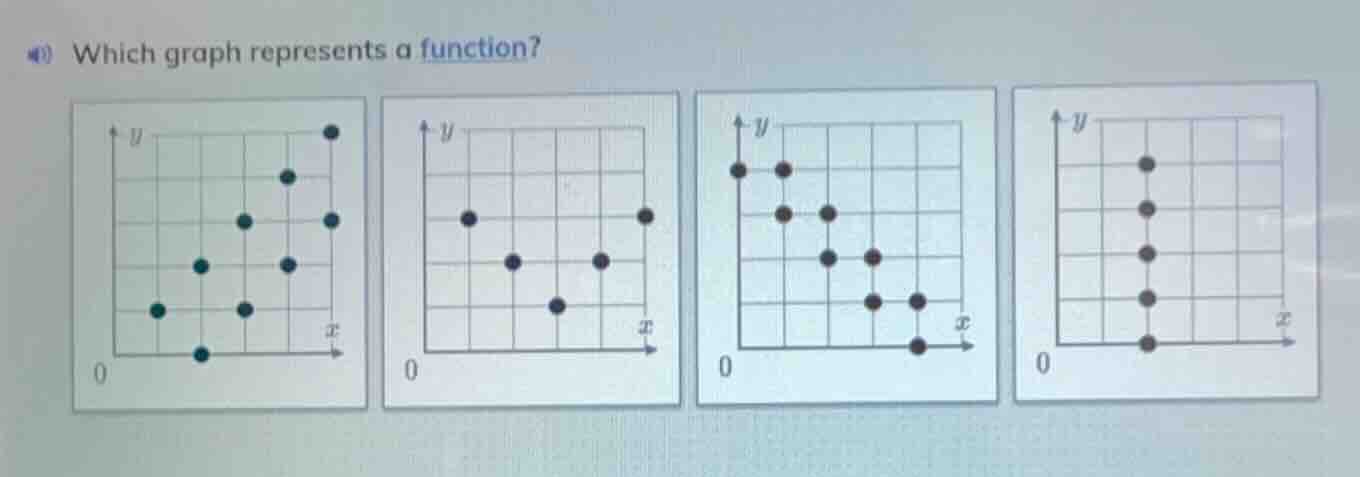
which graph represents a function?
Step1: Recall the vertical line test
A graph represents a function if no vertical line intersects the graph at more than one point. In terms of discrete points (like in these graphs), this means each \( x \)-value (horizontal coordinate) should correspond to only one \( y \)-value (vertical coordinate).
Step2: Analyze each graph
- First graph: Check \( x \)-values. Some \( x \)-values have multiple points (e.g., look for repeated \( x \)-coordinates with different \( y \)-coordinates). So it fails the vertical line test.
- Second graph: Each \( x \)-value (the horizontal position of each dot) has only one \( y \)-value. No two dots share the same \( x \)-coordinate. So it passes the vertical line test.
- Third graph: Some \( x \)-values have multiple dots (same \( x \), different \( y \)), so it fails.
- Fourth graph: One \( x \)-value (the vertical line at that \( x \)) has multiple \( y \)-values (the dots stacked vertically), so it fails.

Snap & solve any problem in the app
Get step-by-step solutions on Sovi AI
Photo-based solutions with guided steps
Explore more problems and detailed explanations
The second graph (from the left) represents a function.