QUESTION IMAGE
Question
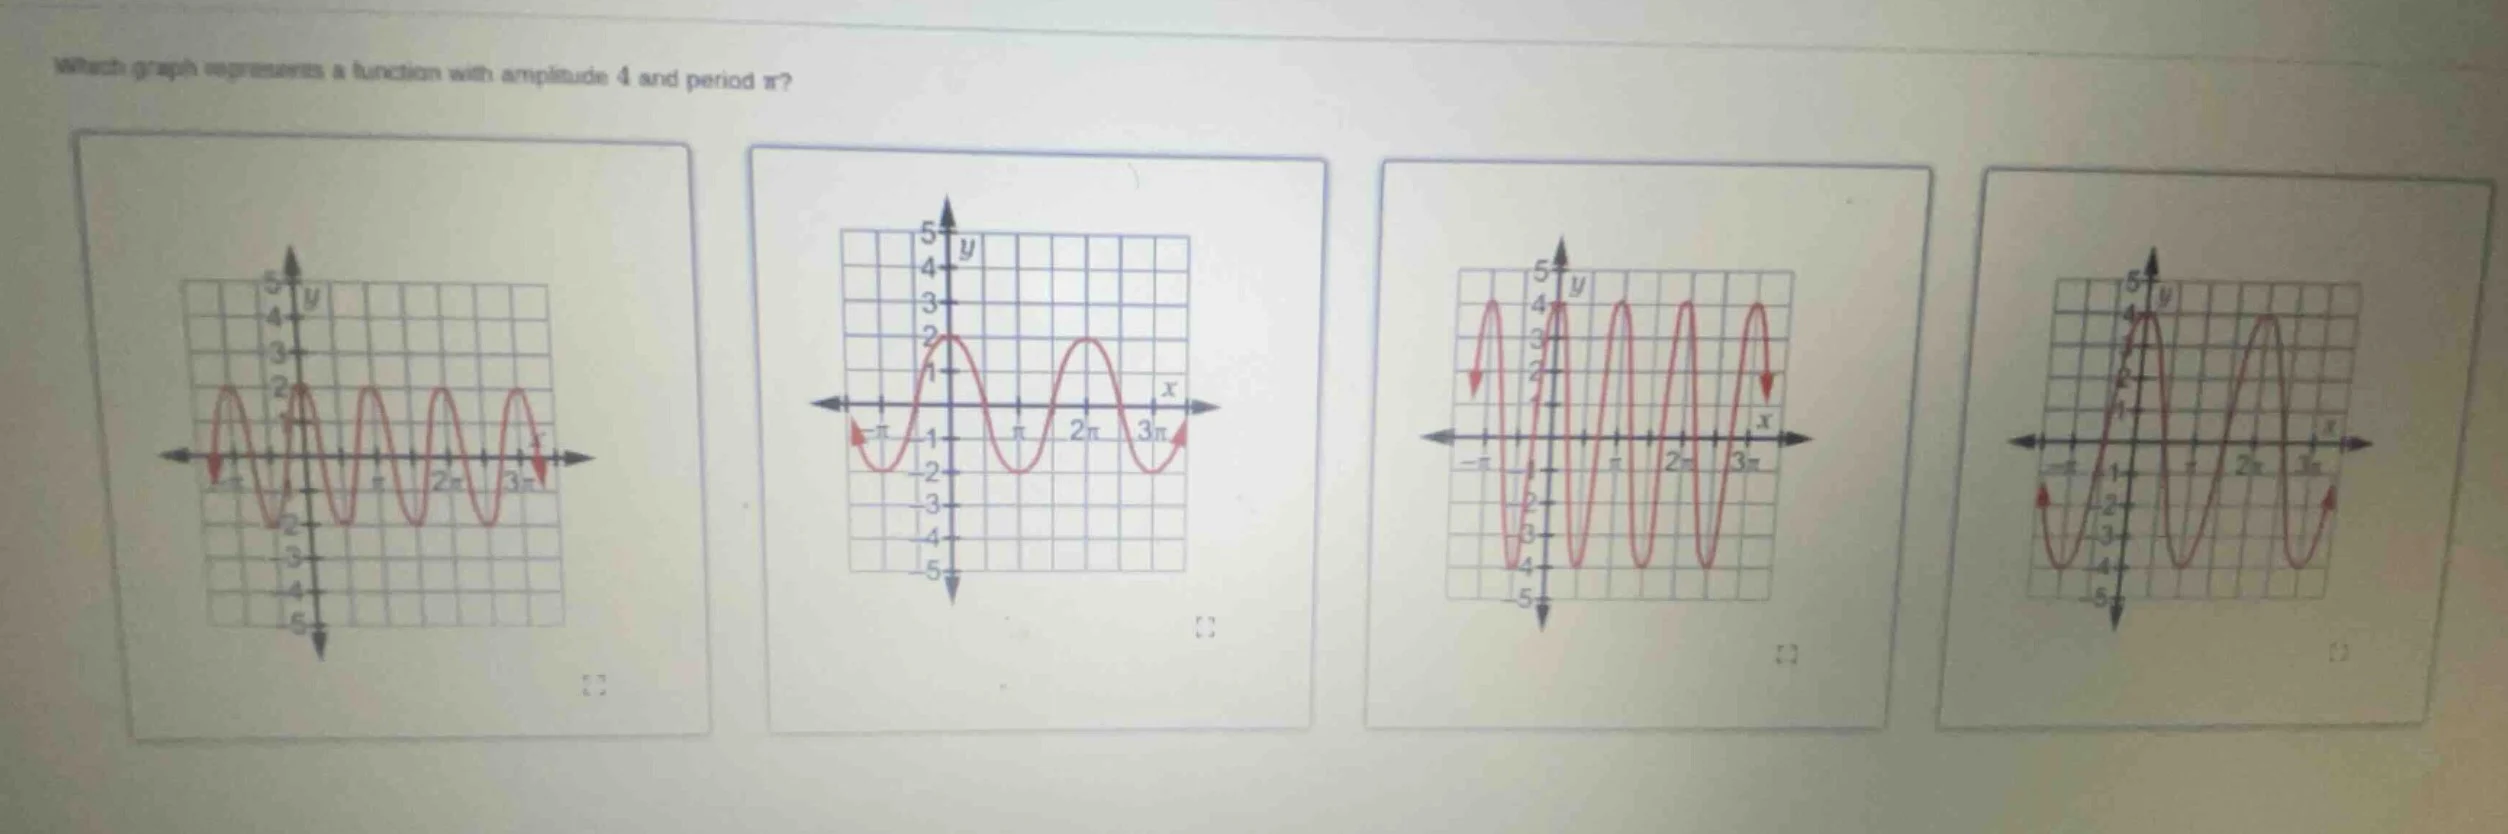
which graph represents a function with amplitude 4 and period $pi$?
Step1: Define amplitude
Amplitude = max |y-value| = 4.
So the graph must reach y=4 and y=-4.
Eliminate graphs 1 (max y=2) and 2 (max y=2).
Step2: Define period
Period = distance between 2 peaks = $\pi$.
In graph 3: from $x=0$ to $x=\pi$ is one full wave (period $\pi$).
In graph 4: from $x=0$ to $x=2\pi$ is one full wave (period $2\pi$).
Eliminate graph 4.

Snap & solve any problem in the app
Get step-by-step solutions on Sovi AI
Photo-based solutions with guided steps
Explore more problems and detailed explanations
The third graph (left-to-right, the one with amplitude 4 and period $\pi$)