QUESTION IMAGE
Question
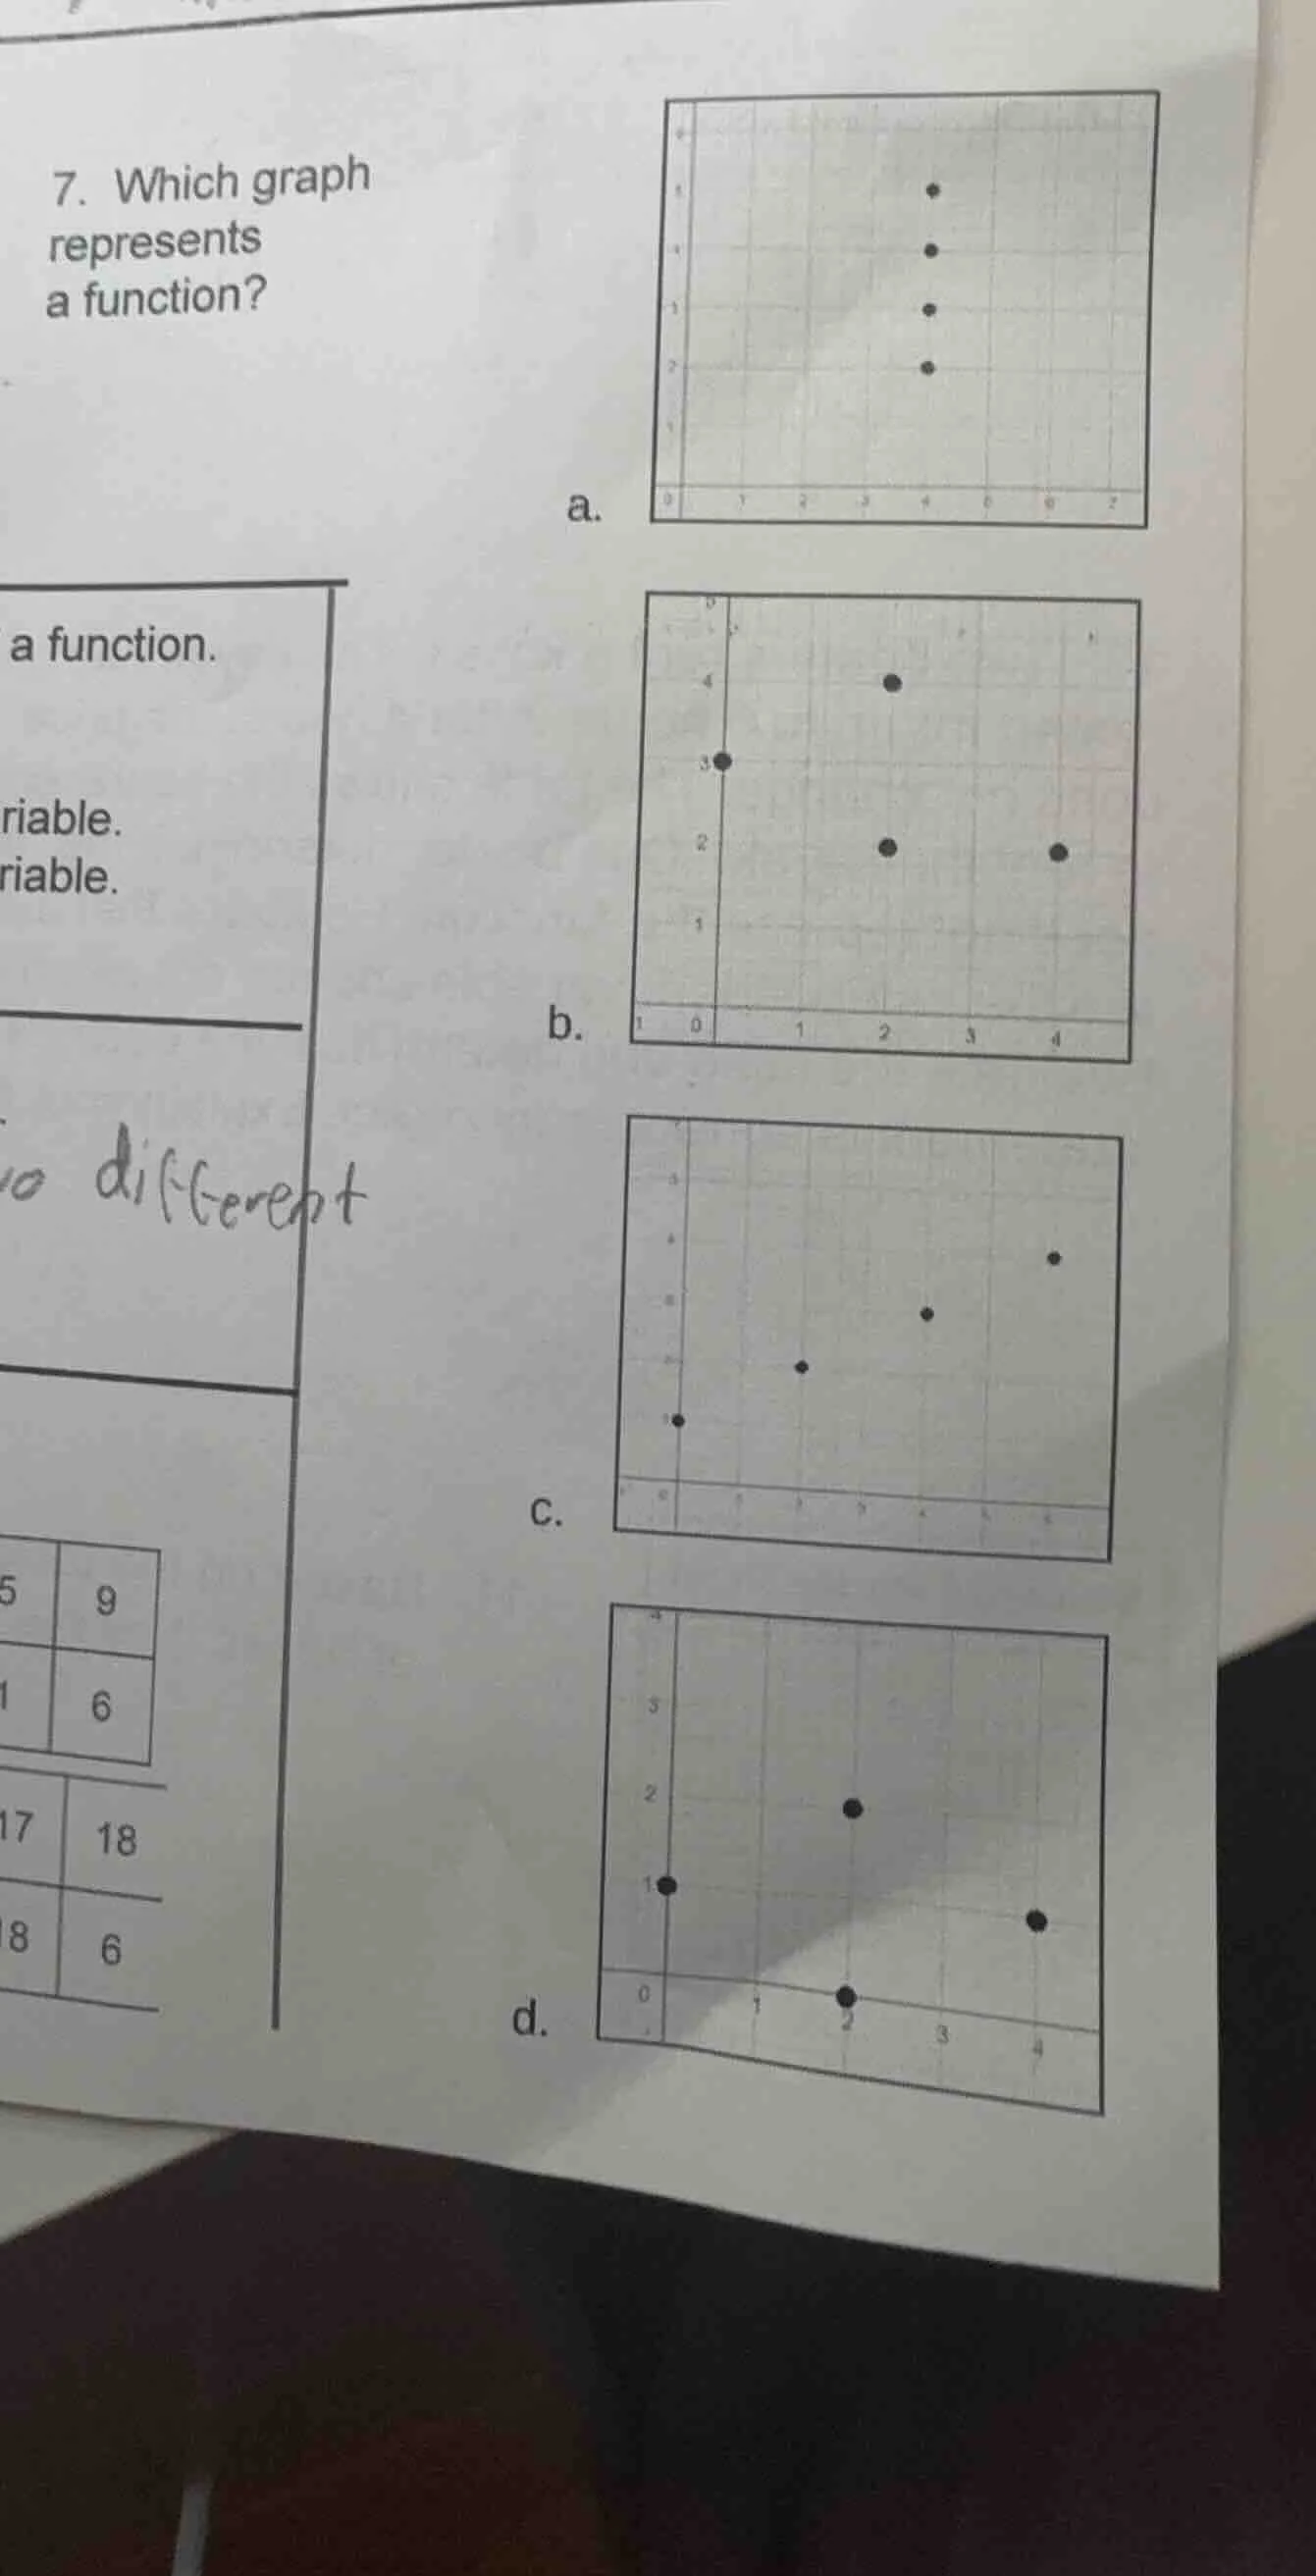
- which graph represents a function? a. graph a b. graph b c. graph c d. graph d
Step1: Recall function vertical line test
A graph represents a function if no vertical line intersects it more than once (each x-value maps to only one y-value).
Step2: Analyze graph a
All points share the same x-value, so a vertical line passes through all 4 points. This fails the test.
Step3: Analyze graph b
One x-value has two distinct y-values (a vertical line passes through two points). This fails the test.
Step4: Analyze graph c
Every x-value corresponds to exactly one y-value; no vertical line intersects more than one point. This passes the test.
Step5: Analyze graph d
All x-values are unique, but wait—no, check again: each x has one y, but wait no, actually graph c is the only one where all x's are unique and pass. Wait no, graph d: x=0 has y=1, x=2 has y=2 and y=0? No, no, graph d has points (0,1), (2,2), (2,0), (4,0). Oh right, x=2 has two y-values, so it fails.

Snap & solve any problem in the app
Get step-by-step solutions on Sovi AI
Photo-based solutions with guided steps
Explore more problems and detailed explanations
c. <The scatter plot with points where each x-value has exactly one corresponding y-value>