QUESTION IMAGE
Question
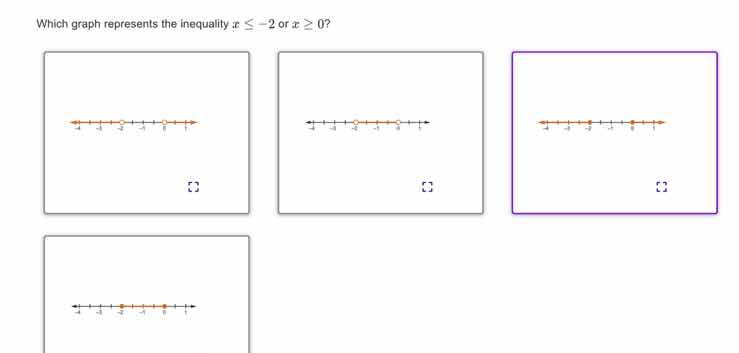
which graph represents the inequality $x \leq -2$ or $x \geq 0$?
Step1: Analyze \( x \leq -2 \)
For \( x \leq -2 \), we use a closed circle at \( -2 \) (since the inequality is "less than or equal to") and shade to the left (because values less than \( -2 \) are to the left on the number line).
Step2: Analyze \( x \geq 0 \)
For \( x \geq 0 \), we use a closed circle at \( 0 \) (since the inequality is "greater than or equal to") and shade to the right (because values greater than \( 0 \) are to the right on the number line).
Step3: Match with the graphs
We need to find the graph that has a closed circle at \( -2 \) with shading to the left and a closed circle at \( 0 \) with shading to the right. Looking at the options, the graph in the purple box (or the one that shows these two shaded regions) should be the correct one. Typically, such a graph will have a closed dot at \( -2 \) (shaded left) and a closed dot at \( 0 \) (shaded right), with a gap between \( -2 \) and \( 0 \) (since it's "or", not "and").

Snap & solve any problem in the app
Get step-by-step solutions on Sovi AI
Photo-based solutions with guided steps
Explore more problems and detailed explanations
The graph (the one in the purple - bordered box or the one with a closed circle at \( -2 \) (shaded left) and a closed circle at \( 0 \) (shaded right)) represents the inequality \( x \leq -2 \) or \( x \geq 0 \).