QUESTION IMAGE
Question
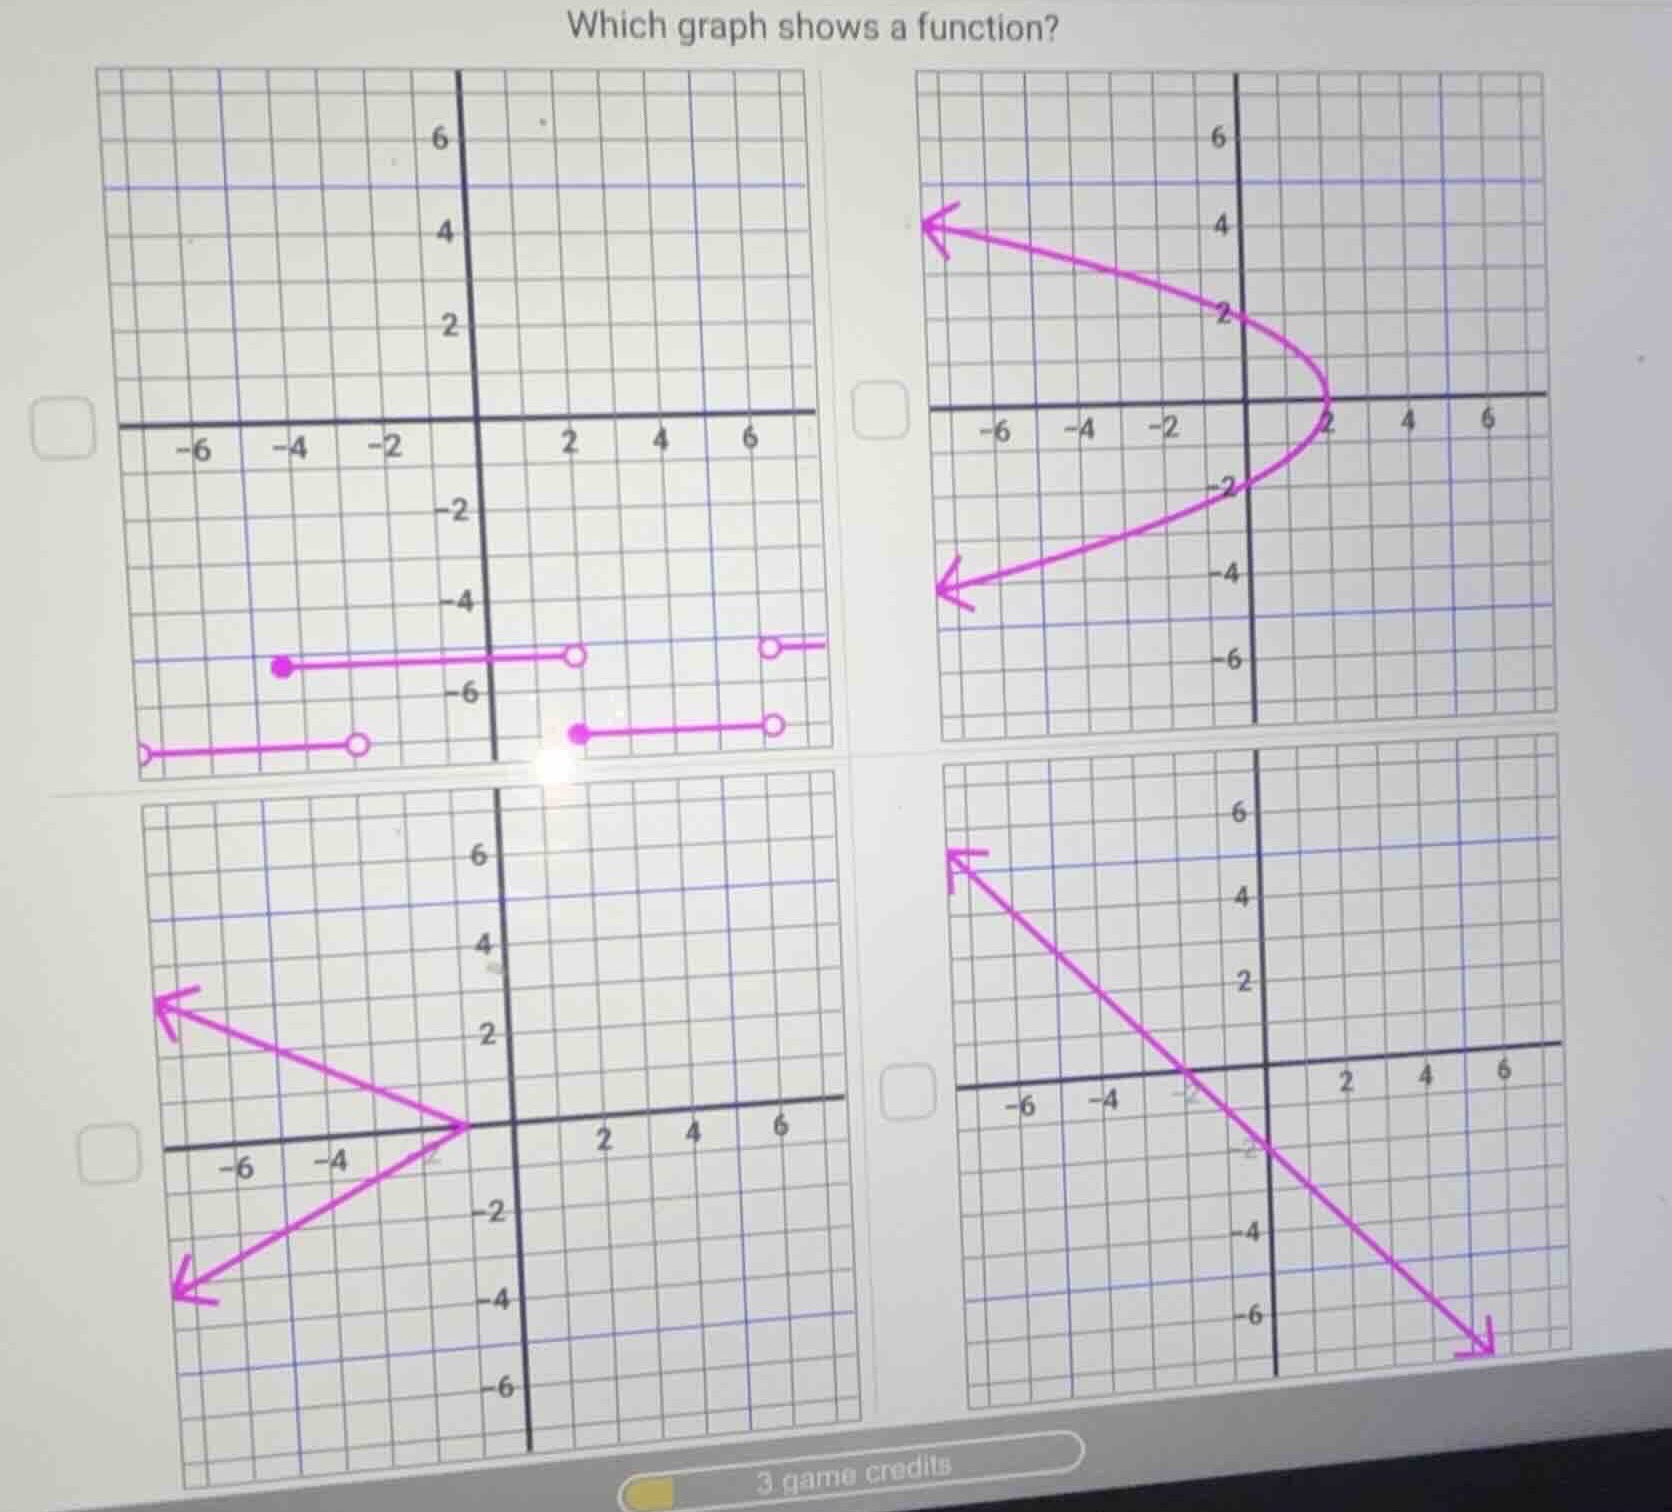
which graph shows a function?
Step1: Recall vertical line test rule
A graph represents a function if no vertical line intersects it more than once.
Step2: Test top-left graph
Vertical lines intersect at most one segment.
Step3: Test top-right graph
A vertical line (e.g., $x=1$) intersects the graph twice.
Step4: Test bottom-left graph
A vertical line (e.g., $x=-3$) intersects the graph twice.
Step5: Test bottom-right graph
All vertical lines intersect the graph exactly once.

Snap & solve any problem in the app
Get step-by-step solutions on Sovi AI
Photo-based solutions with guided steps
Explore more problems and detailed explanations
The bottom-right graph (the straight diagonal line passing through the second and fourth quadrants) is the graph of a function.