QUESTION IMAGE
Question
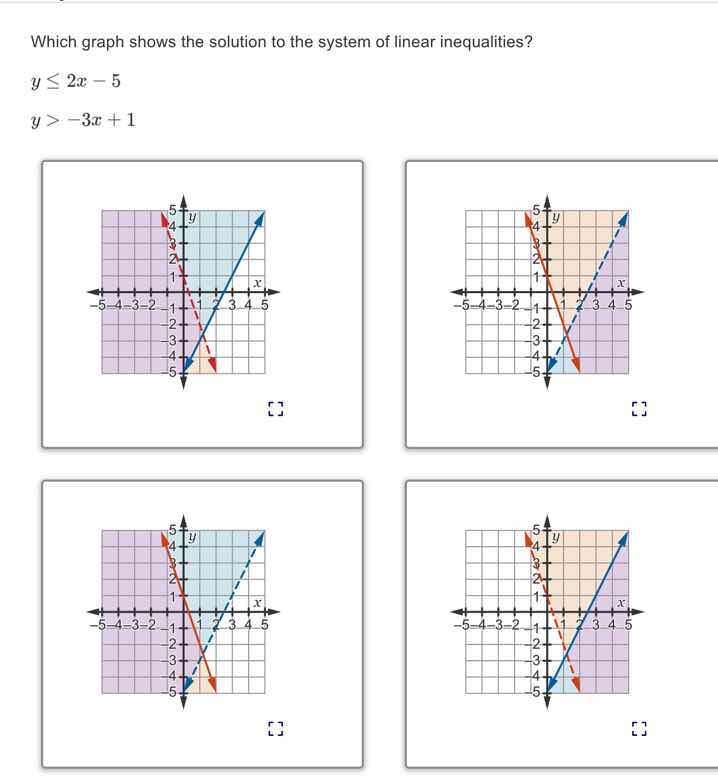
which graph shows the solution to the system of linear inequalities?
y ≤ 2x - 5
y > -3x + 1
Step1: Analyze \( y \leq 2x - 5 \)
The inequality \( y \leq 2x - 5 \) has a linear equation \( y = 2x - 5 \). The slope \( m = 2 \) (positive, rising) and y - intercept \( b=-5 \). Since the inequality is \( \leq \), the line should be solid (to include the points on the line) and we shade below the line.
Step2: Analyze \( y > - 3x + 1 \)
The inequality \( y > - 3x + 1 \) has a linear equation \( y=-3x + 1 \). The slope \( m=-3 \) (negative, falling) and y - intercept \( b = 1\). Since the inequality is \(>\), the line should be dashed (to exclude the points on the line) and we shade above the line.
Step3: Match with the graphs
- Check the y - intercepts: For \( y = 2x-5 \), the y - intercept is \( (0,-5) \) (solid line), for \( y=-3x + 1 \), the y - intercept is \( (0,1) \) (dashed line).
- Check the shading: Shade below \( y = 2x-5 \) (solid) and above \( y=-3x + 1 \) (dashed).
Looking at the four graphs, the third graph (bottom - left) has a solid line with y - intercept \( (0, - 5) \) (for \( y=2x - 5 \)) and a dashed line with y - intercept \( (0,1) \) (for \( y=-3x + 1 \)), and the shading is below the solid line and above the dashed line.

Snap & solve any problem in the app
Get step-by-step solutions on Sovi AI
Photo-based solutions with guided steps
Explore more problems and detailed explanations
The third graph (bottom - left graph) shows the solution to the system of linear inequalities. (Assuming the graphs are ordered from top - left, top - right, bottom - left, bottom - right. If we use labels, if the bottom - left is the third one in the given set of four, that's the one. If we consider the standard way of presenting, the graph with solid line \( y = 2x-5 \) (passing through \( (0,-5) \)) and dashed line \( y=-3x + 1 \) (passing through \( (0,1) \)) with correct shading below the solid and above the dashed is the solution.)