QUESTION IMAGE
Question
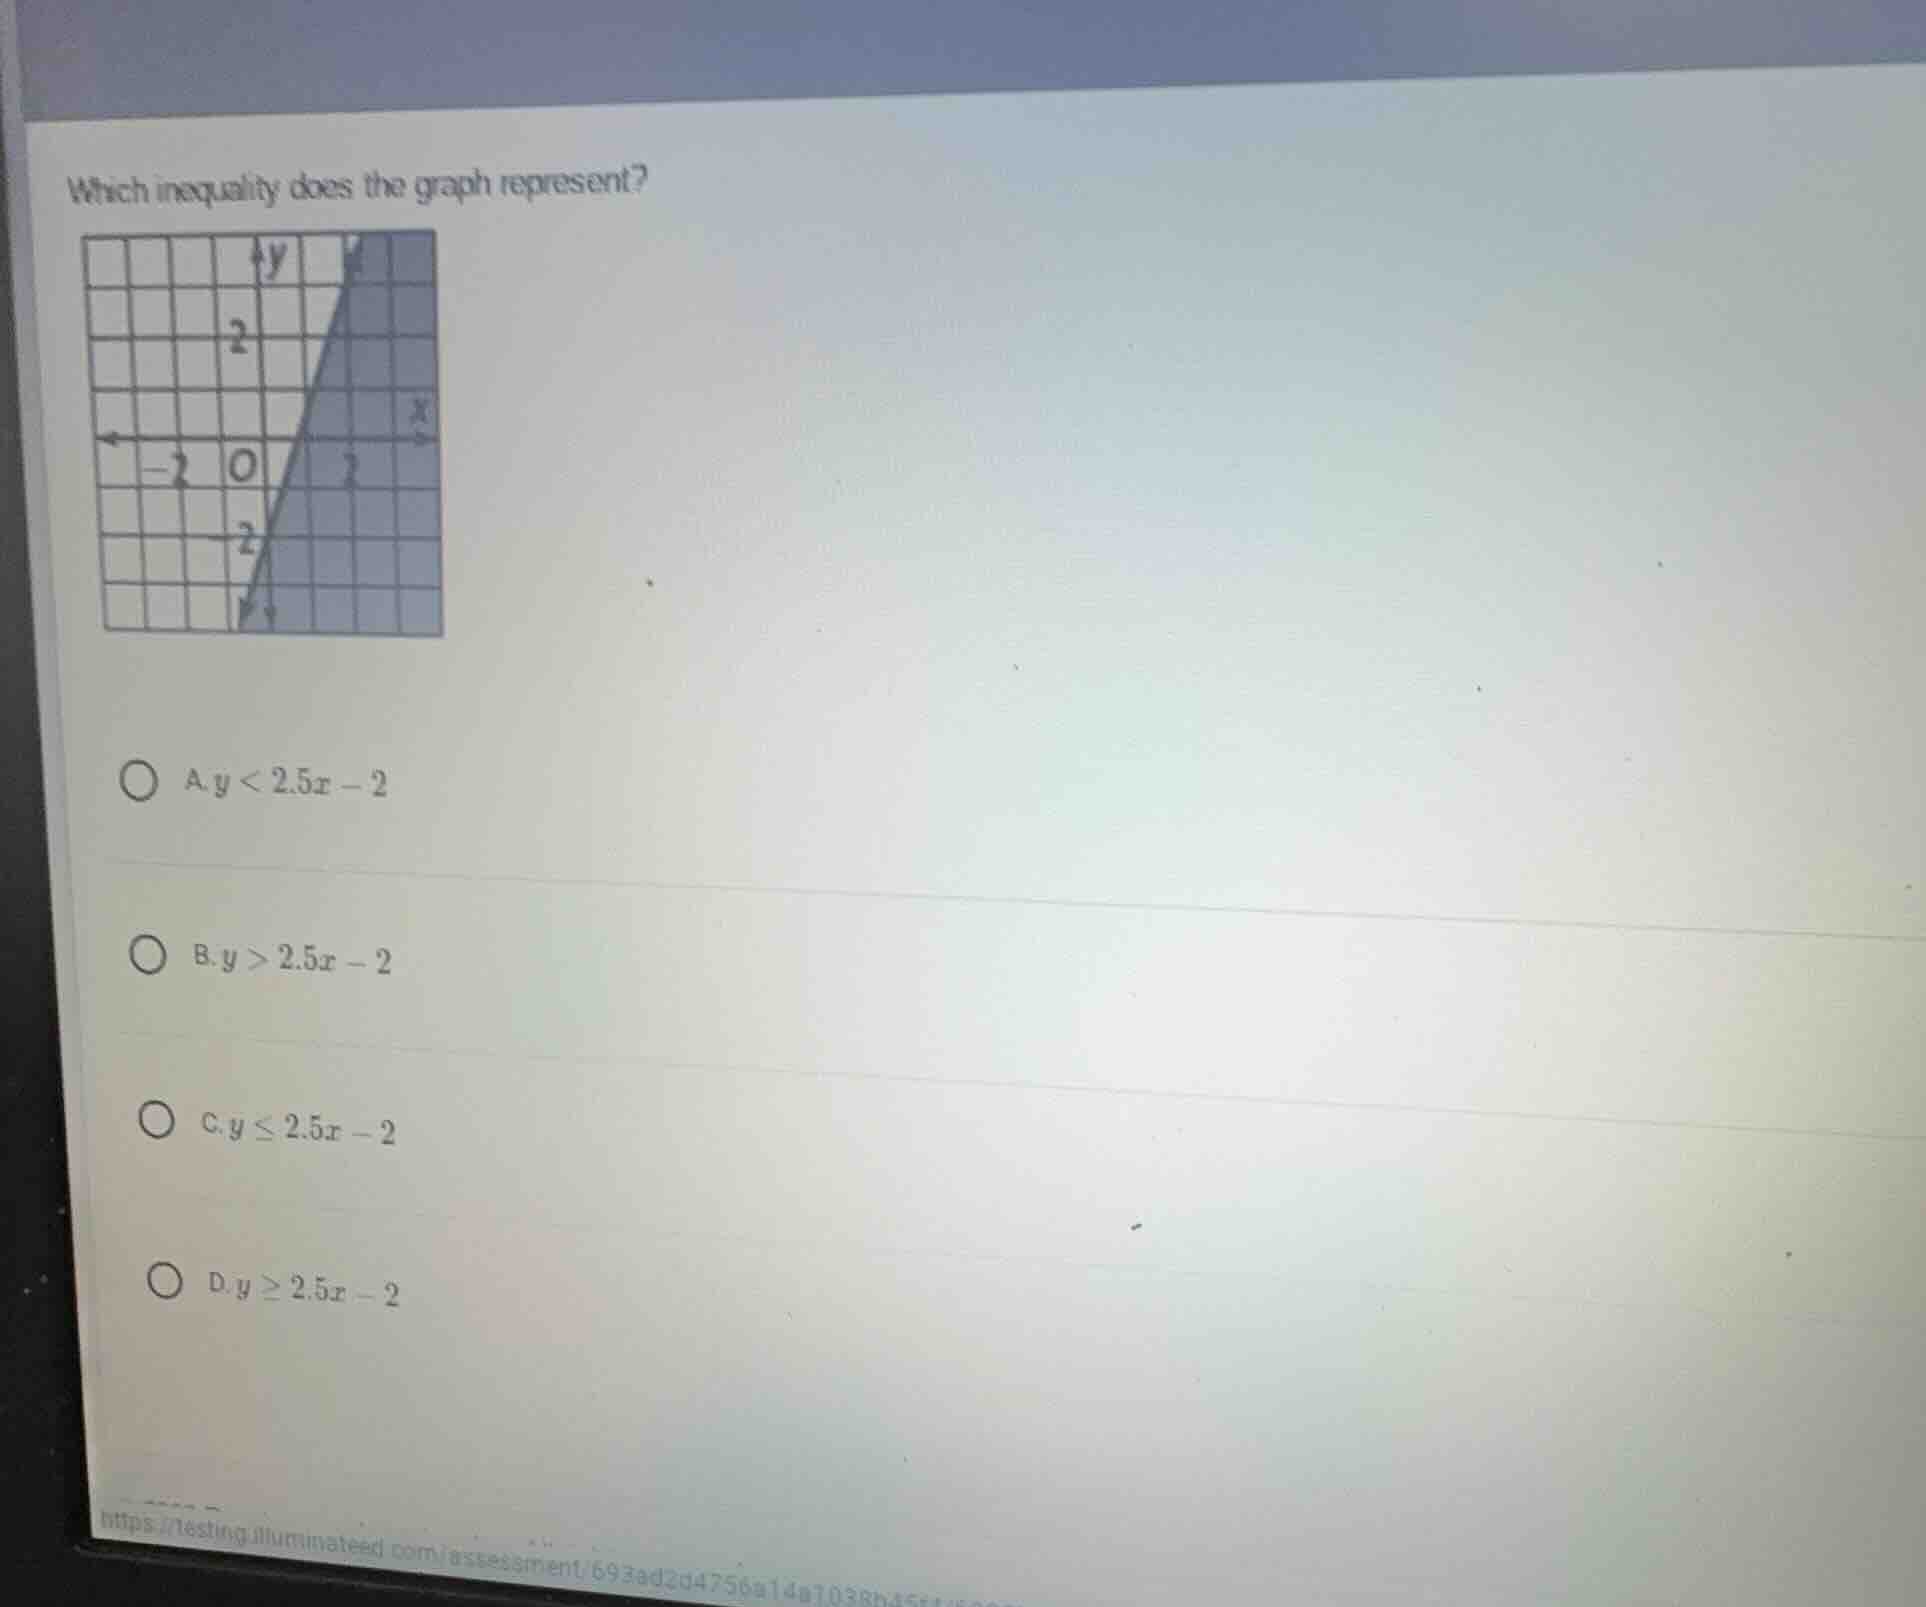
which inequality does the graph represent?
a. $y < 2.5x - 2$
b. $y > 2.5x - 2$
c. $y \leq 2.5x - 2$
d. $y \geq 2.5x - 2$
Step1: Analyze the line type
The graph has a solid line, so the inequality should include equality (either $\leq$ or $\geq$). This eliminates options A and B which have strict inequalities ($<$ or $>$).
Step2: Analyze the shaded region
The shaded region is above the line. For a linear inequality $y = mx + b$, if the shaded region is above the line, the inequality is $y \geq mx + b$ (since above the line means $y$ values are greater than or equal to the line's $y$ values). The line equation here is $y = 2.5x - 2$, and the shaded region is above it with a solid line, so the inequality is $y \geq 2.5x - 2$.

Snap & solve any problem in the app
Get step-by-step solutions on Sovi AI
Photo-based solutions with guided steps
Explore more problems and detailed explanations
D. $y \geq 2.5x - 2$