QUESTION IMAGE
Question
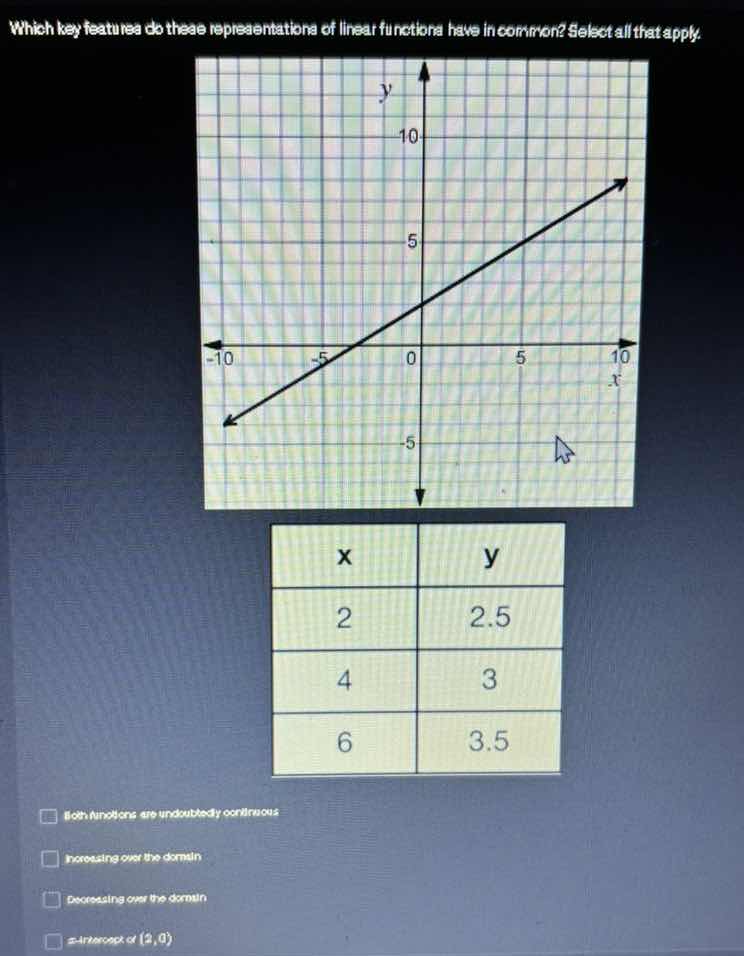
which key features do these representations of linear functions have in common? select all that apply.
(chart and image omitted as per instruction)
both functions are undefined or continuous
increasing over the domain
decreasing over the domain
x - intercept of (2, 0)
Step1: Analyze continuity of functions
Linear functions (both graphed and tabulated, as the table represents a linear relationship) are continuous over their entire domain, so both are continuous.
Step2: Check if functions are increasing
For the graph:
The line rises from left to right, so it has a positive slope. Calculate slope using x-intercept $(-4,0)$ and y-intercept $(0,2)$:
$\text{Slope} = \frac{2-0}{0-(-4)} = \frac{2}{4} = 0.5$
For the table:
Use two points $(2,2.5)$ and $(4,3)$ to find slope:
$\text{Slope} = \frac{3-2.5}{4-2} = \frac{0.5}{2} = 0.25$
Both slopes are positive, so functions are increasing.
Step3: Verify x-intercept
The graph's x-intercept is $(-4,0)$, not $(2,0)$. For the table's function, set $y=0$: first find its equation $y=0.25x+2$. Solve $0=0.25x+2$:
$0.25x = -2 \implies x = -8$, so its x-intercept is $(-8,0)$.
Step4: Rule out decreasing option
Both slopes are positive, so functions are not decreasing.

Snap & solve any problem in the app
Get step-by-step solutions on Sovi AI
Photo-based solutions with guided steps
Explore more problems and detailed explanations
- Both functions are undoubtedly continuous
- Increasing over the domain