QUESTION IMAGE
Question
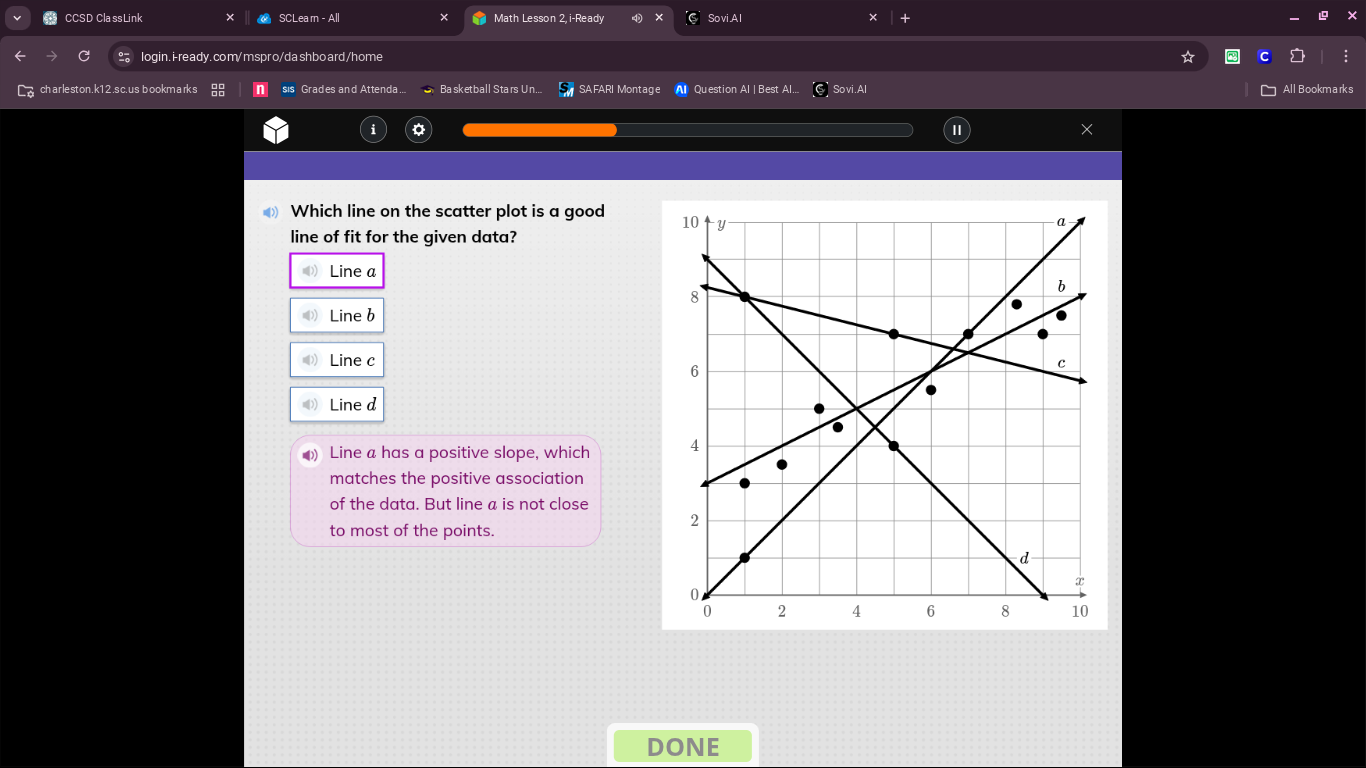
which line on the scatter plot is a good line of fit for the given data? line a line b line c line d line a has a positive slope, which matches the positive association of the data. but line a is not close to most of the points.
Step1: Analyze the data's association
The data points show a positive association (as x increases, y generally increases). So lines with negative slopes (like d) can be eliminated.
Step2: Evaluate closeness to points
- Line a: Positive slope but not close to most points (as noted).
- Line b: Positive slope and appears to be close to most of the data points, following the trend.
- Line c: Let's check—its slope and position relative to points. Wait, line b is better aligned with the cluster of points (around x=2 to x=8, y=3 to y=8). Line b fits the trend of the data points more closely than a or others.
Step3: Confirm the line of fit
A good line of fit should have the same association as the data (positive here) and be close to most data points. Line b has positive slope (matches positive association) and is close to the majority of the points.

Snap & solve any problem in the app
Get step-by-step solutions on Sovi AI
Photo-based solutions with guided steps
Explore more problems and detailed explanations
Line b (the option would be presented as, for example, B. Line b if options were labeled A - D, but based on the choices, the correct line is Line b)