QUESTION IMAGE
Question
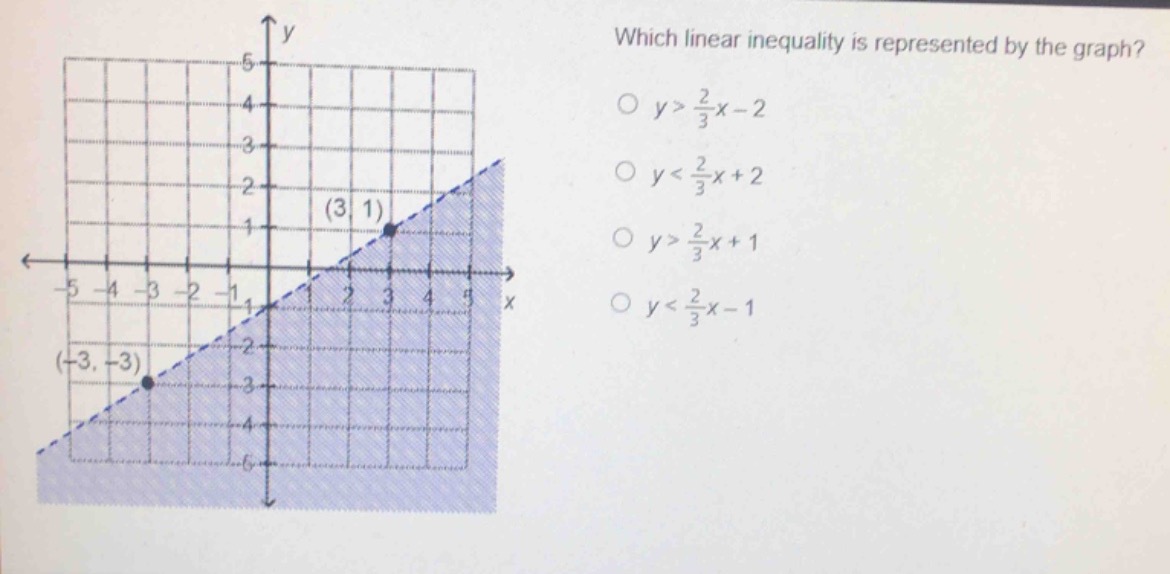
which linear inequality is represented by the graph?
$\bigcirc\\ y>\frac{2}{3}x - 2$
$\bigcirc\\ y<\frac{2}{3}x + 2$
$\bigcirc\\ y>\frac{2}{3}x + 1$
$\bigcirc\\ y<\frac{2}{3}x - 1$
Step1: Find line slope
Slope formula: $m=\frac{y_2-y_1}{x_2-x_1}$
Use points $(3,1)$ and $(-3,-3)$:
$m=\frac{1-(-3)}{3-(-3)}=\frac{4}{6}=\frac{2}{3}$
Step2: Find y-intercept
Use $y=mx+b$, substitute $m=\frac{2}{3}$ and $(3,1)$:
$1=\frac{2}{3}(3)+b$
$1=2+b$
$b=1-2=-1$
Line equation: $y=\frac{2}{3}x-1$
Step3: Determine inequality sign
Dashed line means $<$ or $>$. Shaded region is below the line, so use $<$.

Snap & solve any problem in the app
Get step-by-step solutions on Sovi AI
Photo-based solutions with guided steps
Explore more problems and detailed explanations
$y < \frac{2}{3}x - 1$ (Option D)