QUESTION IMAGE
Question
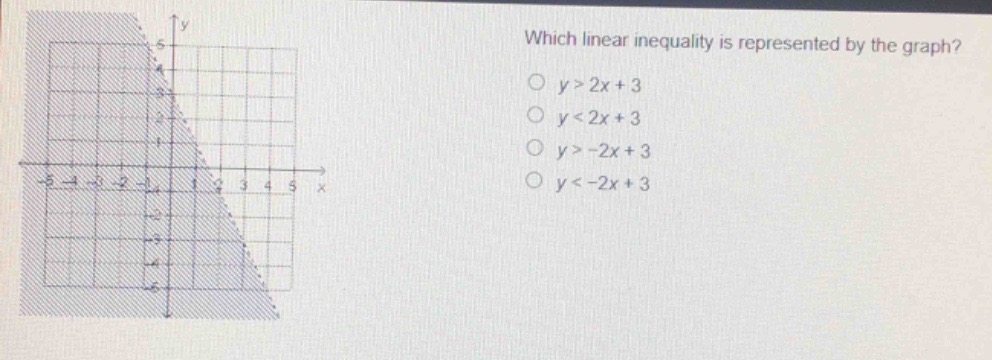
which linear inequality is represented by the graph?
○ $y > 2x + 3$
○ $y < 2x + 3$
○ $y > -2x + 3$
○ $y < -2x + 3$
Step1: Find line equation
The line has y-intercept $3$, slope $\frac{0-3}{1.5-0}=-2$. Equation: $y=-2x+3$.
Step2: Check line style
Dashed line means $<$ or $>$, not $\leq$ or $\geq$.
Step3: Test shaded region
Test point $(0,0)$ (in shaded area): $0 < -2(0)+3 \to 0<3$, which is true.

Snap & solve any problem in the app
Get step-by-step solutions on Sovi AI
Photo-based solutions with guided steps
Explore more problems and detailed explanations
$\boldsymbol{y < -2x + 3}$ (Option D)