QUESTION IMAGE
Question
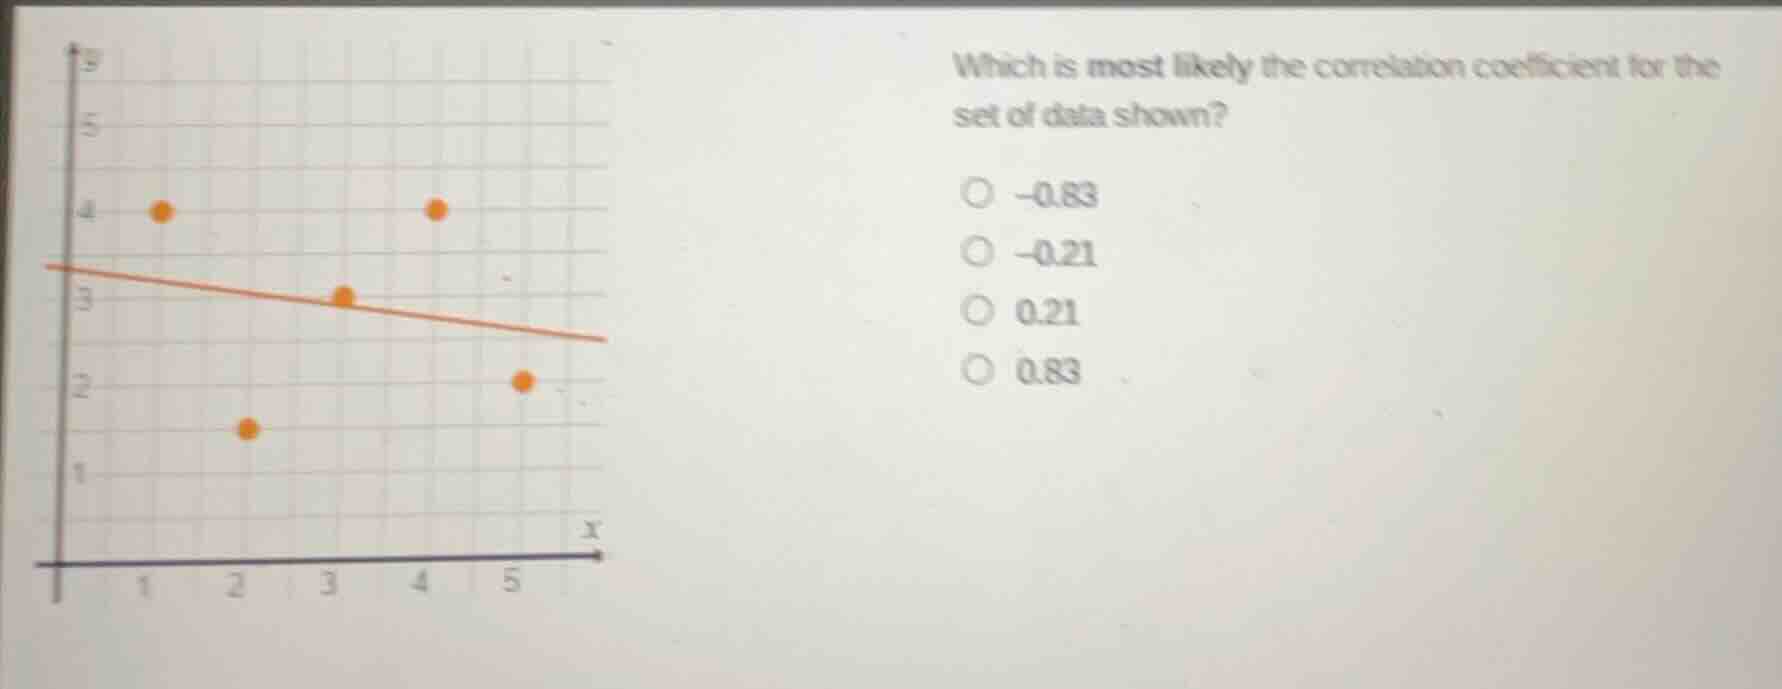
which is most likely the correlation coefficient for the set of data shown? -0.83 -0.21 0.21 0.83
Step1: Identify trend direction
The line of best fit slopes downward, so the correlation coefficient \(r\) is negative. This eliminates the positive options 0.21 and 0.83.
Step2: Assess correlation strength
The data points are loosely scattered around the line, not tightly clustered. A value of -0.83 would indicate a strong negative correlation (points close to the line), while -0.21 indicates a weak negative correlation, matching the scatter.

Snap & solve any problem in the app
Get step-by-step solutions on Sovi AI
Photo-based solutions with guided steps
Explore more problems and detailed explanations
-0.21