QUESTION IMAGE
Question
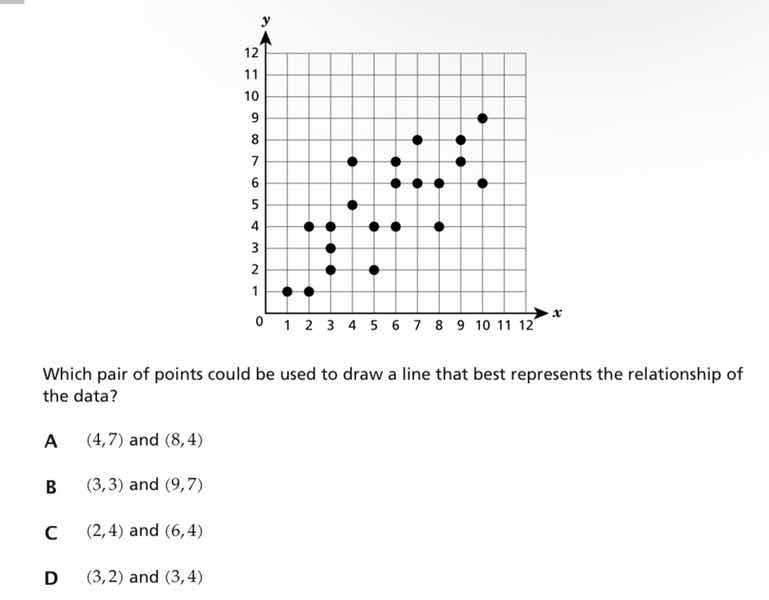
which pair of points could be used to draw a line that best represents the relationship of the data?
a (4,7) and (8,4)
b (3,3) and (9,7)
c (2,4) and (6,4)
d (3,2) and (3,4)
Step1: Analyze the trend of the data
The scatter plot shows a positive correlation, meaning as \( x \) increases, \( y \) generally increases. We need to find a line that follows this trend.
Step2: Check each option
- Option A: Points \((4,7)\) and \((8,4)\). The slope is \(\frac{4 - 7}{8 - 4}=\frac{-3}{4}\), which is negative, not matching the positive trend.
- Option B: Points \((3,3)\) and \((9,7)\). The slope is \(\frac{7 - 3}{9 - 3}=\frac{4}{6}=\frac{2}{3}\), positive slope, following the positive trend.
- Option C: Points \((2,4)\) and \((6,4)\). The slope is \(\frac{4 - 4}{6 - 2}=0\), horizontal line, not matching the upward trend.
- Option D: Points \((3,2)\) and \((3,4)\). The slope is undefined (vertical line), not matching the trend.

Snap & solve any problem in the app
Get step-by-step solutions on Sovi AI
Photo-based solutions with guided steps
Explore more problems and detailed explanations
B. \((3,3)\) and \((9,7)\)