QUESTION IMAGE
Question
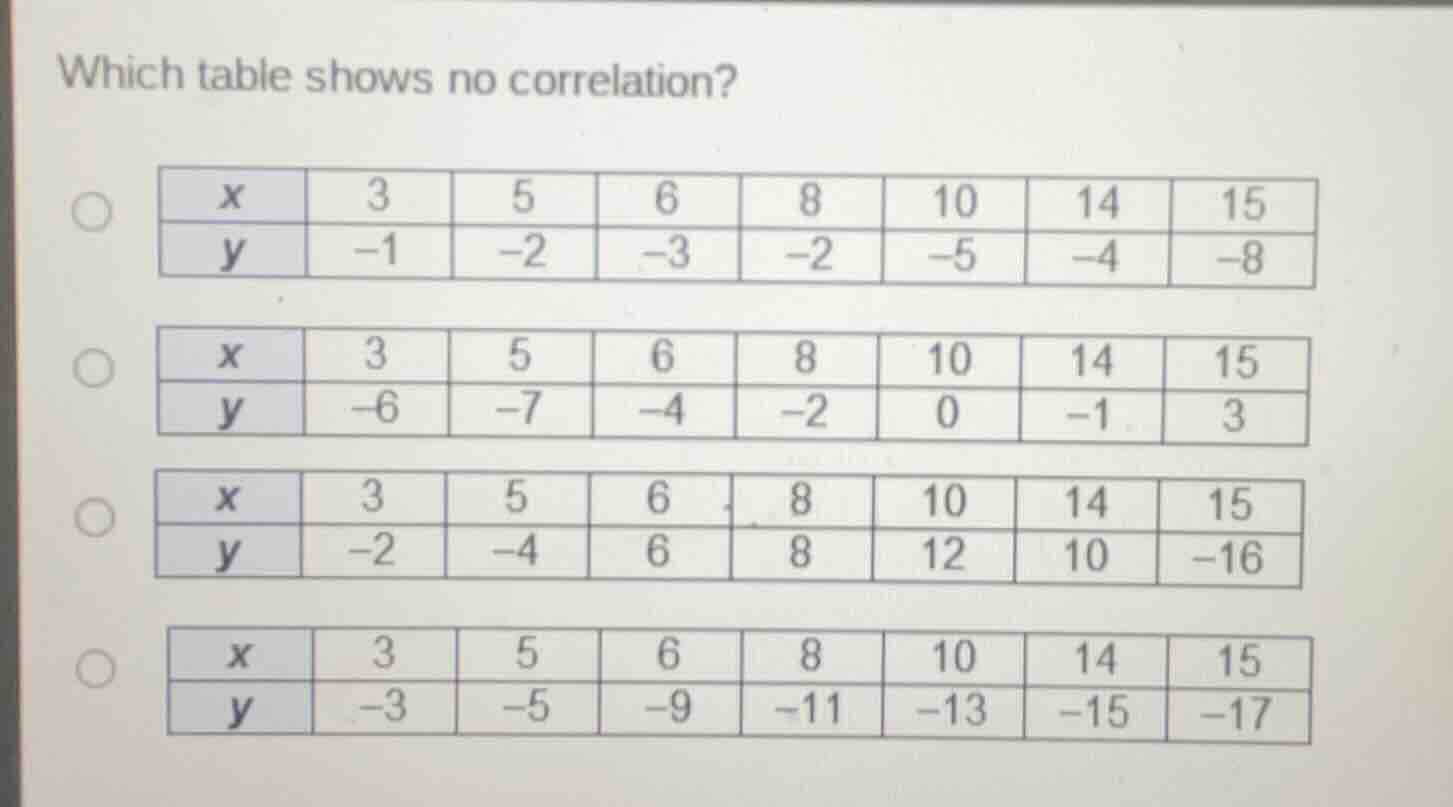
which table shows no correlation?
option 1:
| x | 3 | 5 | 6 | 8 | 10 | 14 | 15 |
| y | -1 | -2 | -3 | -2 | -5 | -4 | -8 |
option 2:
| x | 3 | 5 | 6 | 8 | 10 | 14 | 15 |
| y | -6 | -7 | -4 | -2 | 0 | -1 | 3 |
option 3:
| x | 3 | 5 | 6 | 8 | 10 | 14 | 15 |
| y | -2 | -4 | 6 | 8 | 12 | 10 | -16 |
option 4:
| x | 3 | 5 | 6 | 8 | 10 | 14 | 15 |
| y | -3 | -5 | -9 | -11 | -13 | -15 | -17 |
Step1: Define no correlation
No correlation means as $x$ increases, $y$ has no consistent upward/downward trend.
Step2: Analyze Table 1
$x$ increases, $y$ mostly decreases (weak negative correlation).
Step3: Analyze Table 2
$x$ increases, $y$ mostly increases (weak positive correlation).
Step4: Analyze Table 3
$x$ increases, $y$ fluctuates randomly: $-2\to-4\to6\to8\to12\to10\to-16$ (no consistent trend).
Step5: Analyze Table 4
$x$ increases, $y$ steadily decreases (strong negative correlation).

Snap & solve any problem in the app
Get step-by-step solutions on Sovi AI
Photo-based solutions with guided steps
Explore more problems and detailed explanations
The table with $x$ values 3, 5, 6, 8, 10, 14, 15 and $y$ values -2, -4, 6, 8, 12, 10, -16 (the third option) shows no correlation.