QUESTION IMAGE
Question
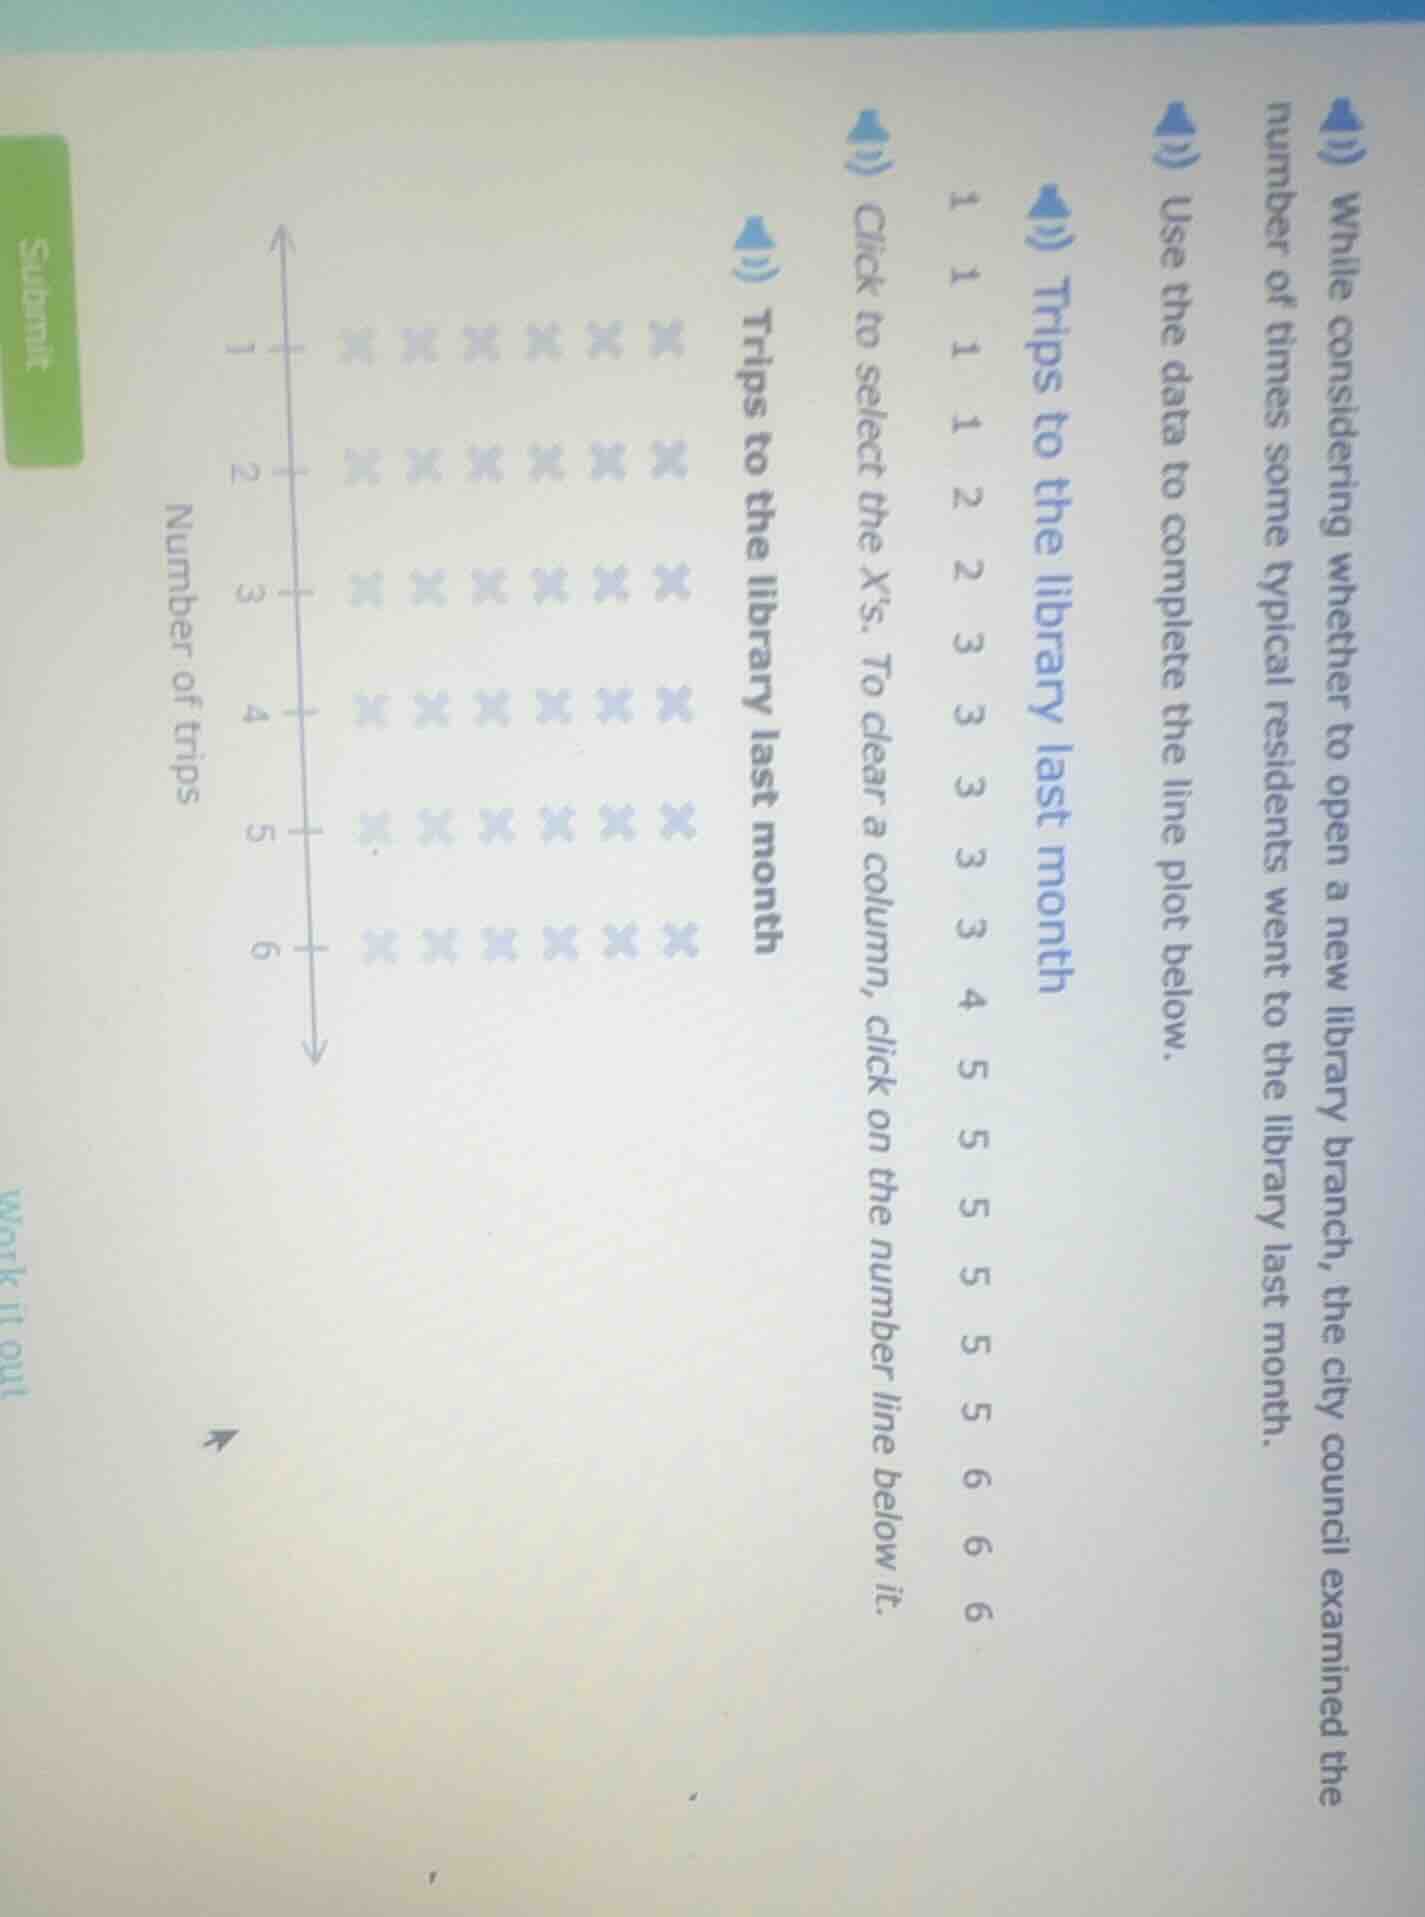
while considering whether to open a new library branch, the city council examined the number of times some typical residents went to the library last month. use the data to complete the line plot below. trips to the library last month 1 1 1 1 2 2 3 3 3 3 3 4 5 5 5 5 5 5 5 6 6 6 click to select the xs. to clear a column, click on the number line below it. trips to the library last month number of trips
To complete the line plot, we count the frequency of each number of trips:
Step 1: Count trips for "1"
The data has four "1"s? Wait, no—wait the data list: "1, 1, 1, 1, 2, 2, 3, 3, 3, 3, 3, 3, 4, 5, 5, 5, 5, 5, 5, 5, 6, 6, 6"? Wait, no, let's re - examine the data: The given data is "1, 1, 1, 1, 2, 2, 3, 3, 3, 3, 3, 3, 4, 5, 5, 5, 5, 5, 5, 5, 6, 6, 6"? Wait, no, the original data as per the problem: Let's list the counts properly.
Wait, the data points are:
- For 1: Let's count how many times 1 appears. The data is "1, 1, 1, 1" → 4 times? Wait, no, looking at the data: "1, 1, 1, 1, 2, 2, 3, 3, 3, 3, 3, 3, 4, 5, 5, 5, 5, 5, 5, 5, 6, 6, 6"? Wait, no, maybe I misread. Wait the data is: 1 (four times), 2 (two times), 3 (six times), 4 (one time), 5 (eight times), 6 (three times). Wait, no, let's count again:
Given data: "1, 1, 1, 1, 2, 2, 3, 3, 3, 3, 3, 3, 4, 5, 5, 5, 5, 5, 5, 5, 6, 6, 6"
- Number of 1s: 4
- Number of 2s: 2
- Number of 3s: 6
- Number of 4s: 1
- Number of 5s: 8
- Number of 6s: 3
But the line plot has columns for 1, 2, 3, 4, 5, 6.
Now, to plot:
- For 1: We need to mark 4 X's (but in the given line plot, the 1 column already has some X's? Wait, the problem says "Click to select the X’s. To clear a column, click on the number line below it." So we need to ensure the number of X's in each column matches the frequency.
Wait, maybe the initial line plot has some X's, but we need to adjust. Wait, perhaps the correct counts are:
Wait, let's re - express the data:
Data points:
1: 4 times
2: 2 times
3: 6 times
4: 1 time
5: 8 times
6: 3 times
But maybe the line plot is pre - drawn with some X's, and we need to add the correct number. However, since this is a line plot construction, the key is to count the frequency of each number of trips and mark the X's accordingly.
But if we assume that we need to complete the line plot by marking the correct number of X's for each category:
- For 1: 4 X's (but maybe the initial has some, so we check)
- For 2: 2 X's
- For 3: 6 X's
- For 4: 1 X
- For 5: 8 X's
- For 6: 3 X's
But since the problem is about constructing the line plot, the process is to count the frequency of each number of trips (1, 2, 3, 4, 5, 6) from the given data and then mark the corresponding number of X's in each column of the line plot.
For example, if the data for number of trips is:
- 1: occurs 4 times
- 2: occurs 2 times
- 3: occurs 6 times
- 4: occurs 1 time
- 5: occurs 8 times
- 6: occurs 3 times
So in the line plot, above the number "1" on the number line, we draw 4 X's (if not already done), above "2" draw 2 X's, above "3" draw 6 X's, above "4" draw 1 X, above "5" draw 8 X's, and above "6" draw 3 X's.
But since the problem is about completing the line plot, the final action is to mark the X's based on the frequency counts. If we consider the answer as the completed line plot with correct X counts, but since we can't draw here, the key is the frequency counts.
However, if we assume that the line plot is to be filled with X's such that:
- For 1: 4 X's
- For 2: 2 X's
- For 3: 6 X's
- For 4: 1 X
- For 5: 8 X's
- For 6: 3 X's
So the line plot should have, for each number of trips (1 - 6), the number of X's equal to the frequency of that number in the data.
(Note: If this was a question to find a measure like mean, median, etc., we could calculate, but since it's line plot construction, the main step is frequency counting.)
If we were to find a measure, say the mode (most frequent), it's 5 (occurs 8 times). But since the problem is about line plot, the answer is the completed line plot with X's as pe…

Snap & solve any problem in the app
Get step-by-step solutions on Sovi AI
Photo-based solutions with guided steps
Explore more problems and detailed explanations
To complete the line plot, we count the frequency of each number of trips:
Step 1: Count trips for "1"
The data has four "1"s? Wait, no—wait the data list: "1, 1, 1, 1, 2, 2, 3, 3, 3, 3, 3, 3, 4, 5, 5, 5, 5, 5, 5, 5, 6, 6, 6"? Wait, no, let's re - examine the data: The given data is "1, 1, 1, 1, 2, 2, 3, 3, 3, 3, 3, 3, 4, 5, 5, 5, 5, 5, 5, 5, 6, 6, 6"? Wait, no, the original data as per the problem: Let's list the counts properly.
Wait, the data points are:
- For 1: Let's count how many times 1 appears. The data is "1, 1, 1, 1" → 4 times? Wait, no, looking at the data: "1, 1, 1, 1, 2, 2, 3, 3, 3, 3, 3, 3, 4, 5, 5, 5, 5, 5, 5, 5, 6, 6, 6"? Wait, no, maybe I misread. Wait the data is: 1 (four times), 2 (two times), 3 (six times), 4 (one time), 5 (eight times), 6 (three times). Wait, no, let's count again:
Given data: "1, 1, 1, 1, 2, 2, 3, 3, 3, 3, 3, 3, 4, 5, 5, 5, 5, 5, 5, 5, 6, 6, 6"
- Number of 1s: 4
- Number of 2s: 2
- Number of 3s: 6
- Number of 4s: 1
- Number of 5s: 8
- Number of 6s: 3
But the line plot has columns for 1, 2, 3, 4, 5, 6.
Now, to plot:
- For 1: We need to mark 4 X's (but in the given line plot, the 1 column already has some X's? Wait, the problem says "Click to select the X’s. To clear a column, click on the number line below it." So we need to ensure the number of X's in each column matches the frequency.
Wait, maybe the initial line plot has some X's, but we need to adjust. Wait, perhaps the correct counts are:
Wait, let's re - express the data:
Data points:
1: 4 times
2: 2 times
3: 6 times
4: 1 time
5: 8 times
6: 3 times
But maybe the line plot is pre - drawn with some X's, and we need to add the correct number. However, since this is a line plot construction, the key is to count the frequency of each number of trips and mark the X's accordingly.
But if we assume that we need to complete the line plot by marking the correct number of X's for each category:
- For 1: 4 X's (but maybe the initial has some, so we check)
- For 2: 2 X's
- For 3: 6 X's
- For 4: 1 X
- For 5: 8 X's
- For 6: 3 X's
But since the problem is about constructing the line plot, the process is to count the frequency of each number of trips (1, 2, 3, 4, 5, 6) from the given data and then mark the corresponding number of X's in each column of the line plot.
For example, if the data for number of trips is:
- 1: occurs 4 times
- 2: occurs 2 times
- 3: occurs 6 times
- 4: occurs 1 time
- 5: occurs 8 times
- 6: occurs 3 times
So in the line plot, above the number "1" on the number line, we draw 4 X's (if not already done), above "2" draw 2 X's, above "3" draw 6 X's, above "4" draw 1 X, above "5" draw 8 X's, and above "6" draw 3 X's.
But since the problem is about completing the line plot, the final action is to mark the X's based on the frequency counts. If we consider the answer as the completed line plot with correct X counts, but since we can't draw here, the key is the frequency counts.
However, if we assume that the line plot is to be filled with X's such that:
- For 1: 4 X's
- For 2: 2 X's
- For 3: 6 X's
- For 4: 1 X
- For 5: 8 X's
- For 6: 3 X's
So the line plot should have, for each number of trips (1 - 6), the number of X's equal to the frequency of that number in the data.
(Note: If this was a question to find a measure like mean, median, etc., we could calculate, but since it's line plot construction, the main step is frequency counting.)
If we were to find a measure, say the mode (most frequent), it's 5 (occurs 8 times). But since the problem is about line plot, the answer is the completed line plot with X's as per frequency.
But since the user might expect the frequency counts, here are the counts:
- Trips = 1: 4
- Trips = 2: 2
- Trips = 3: 6
- Trips = 4: 1
- Trips = 5: 8
- Trips = 6: 3
To complete the line plot, mark the X's in each column (above 1, 2, 3, 4, 5, 6) with the number of X's equal to the above counts.
If we consider the answer as the completed line plot description, but since we can't draw, the key is the frequency - based X marking.
But if we assume the question is to find the mode (most common number of trips), the answer is 5 (since it occurs 8 times, more than any other number).
Wait, maybe the problem is to complete the line plot, so the answer is the line plot with X's as follows:
- Above 1: 4 X's
- Above 2: 2 X's
- Above 3: 6 X's
- Above 4: 1 X
- Above 5: 8 X's
- Above 6: 3 X's
So the final answer (if mode is asked) is 5, but if it's line plot completion, the X's are marked as per the frequency counts. Since the problem says "Use the data to complete the line plot below", the answer is the line plot with X's in each column corresponding to the frequency of each number of trips (1:4, 2:2, 3:6, 4:1, 5:8, 6:3).