QUESTION IMAGE
Question
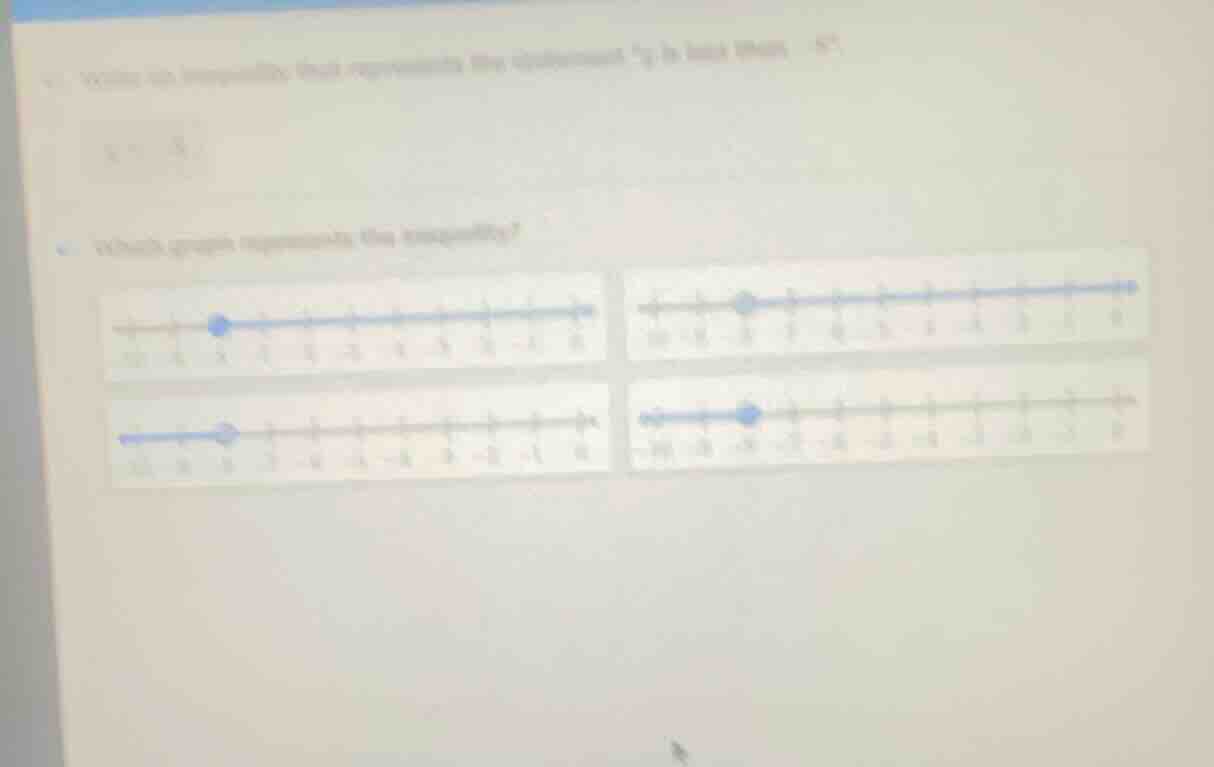
a. write an inequality that represents the statement \x is less than or equal to -8\.
b. which graph represents the inequality? (four number line graphs are shown, but details of the graphs are as per the image context))
Step1: Translate statement to inequality
The statement "x is less than -8" translates directly to $x < -8$.
Step2: Identify correct number line graph
A graph for $x < -8$ has an open circle at $-8$ (since $x$ cannot equal $-8$) and an arrow pointing left (toward smaller numbers) to show all values less than $-8$. This matches the bottom-left graph.

Snap & solve any problem in the app
Get step-by-step solutions on Sovi AI
Photo-based solutions with guided steps
Explore more problems and detailed explanations
- The inequality is $x < -8$
- The correct graph is the bottom-left one (open circle at -8, arrow pointing left to smaller numbers)