QUESTION IMAGE
Question
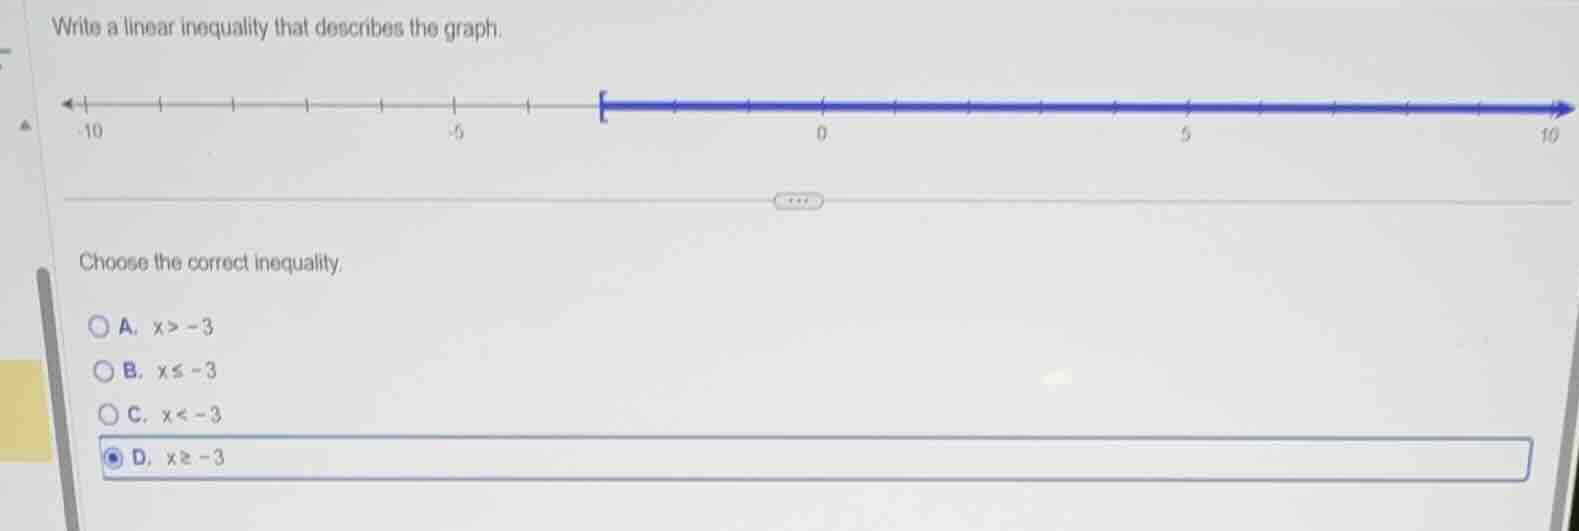
write a linear inequality that describes the graph.
choose the correct inequality.
a. $x > -3$
b. $x \leq -3$
c. $x < -3$
d. $x \geq -3$
Brief Explanations
- Identify the plotted point on the number line: it is at -3.
- The closed (filled) bracket at -3 means the value -3 is included in the solution set, so we use $\geq$ or $\leq$.
- The blue arrow extends to the right, representing all values greater than -3.
- Combining these, the inequality includes -3 and all values larger than -3.

Snap & solve any problem in the app
Get step-by-step solutions on Sovi AI
Photo-based solutions with guided steps
Explore more problems and detailed explanations
D. $x \geq -3$