QUESTION IMAGE
Question
you got it right - just one more to go!
roseburg housing office analyzes the number of people per building on every street.
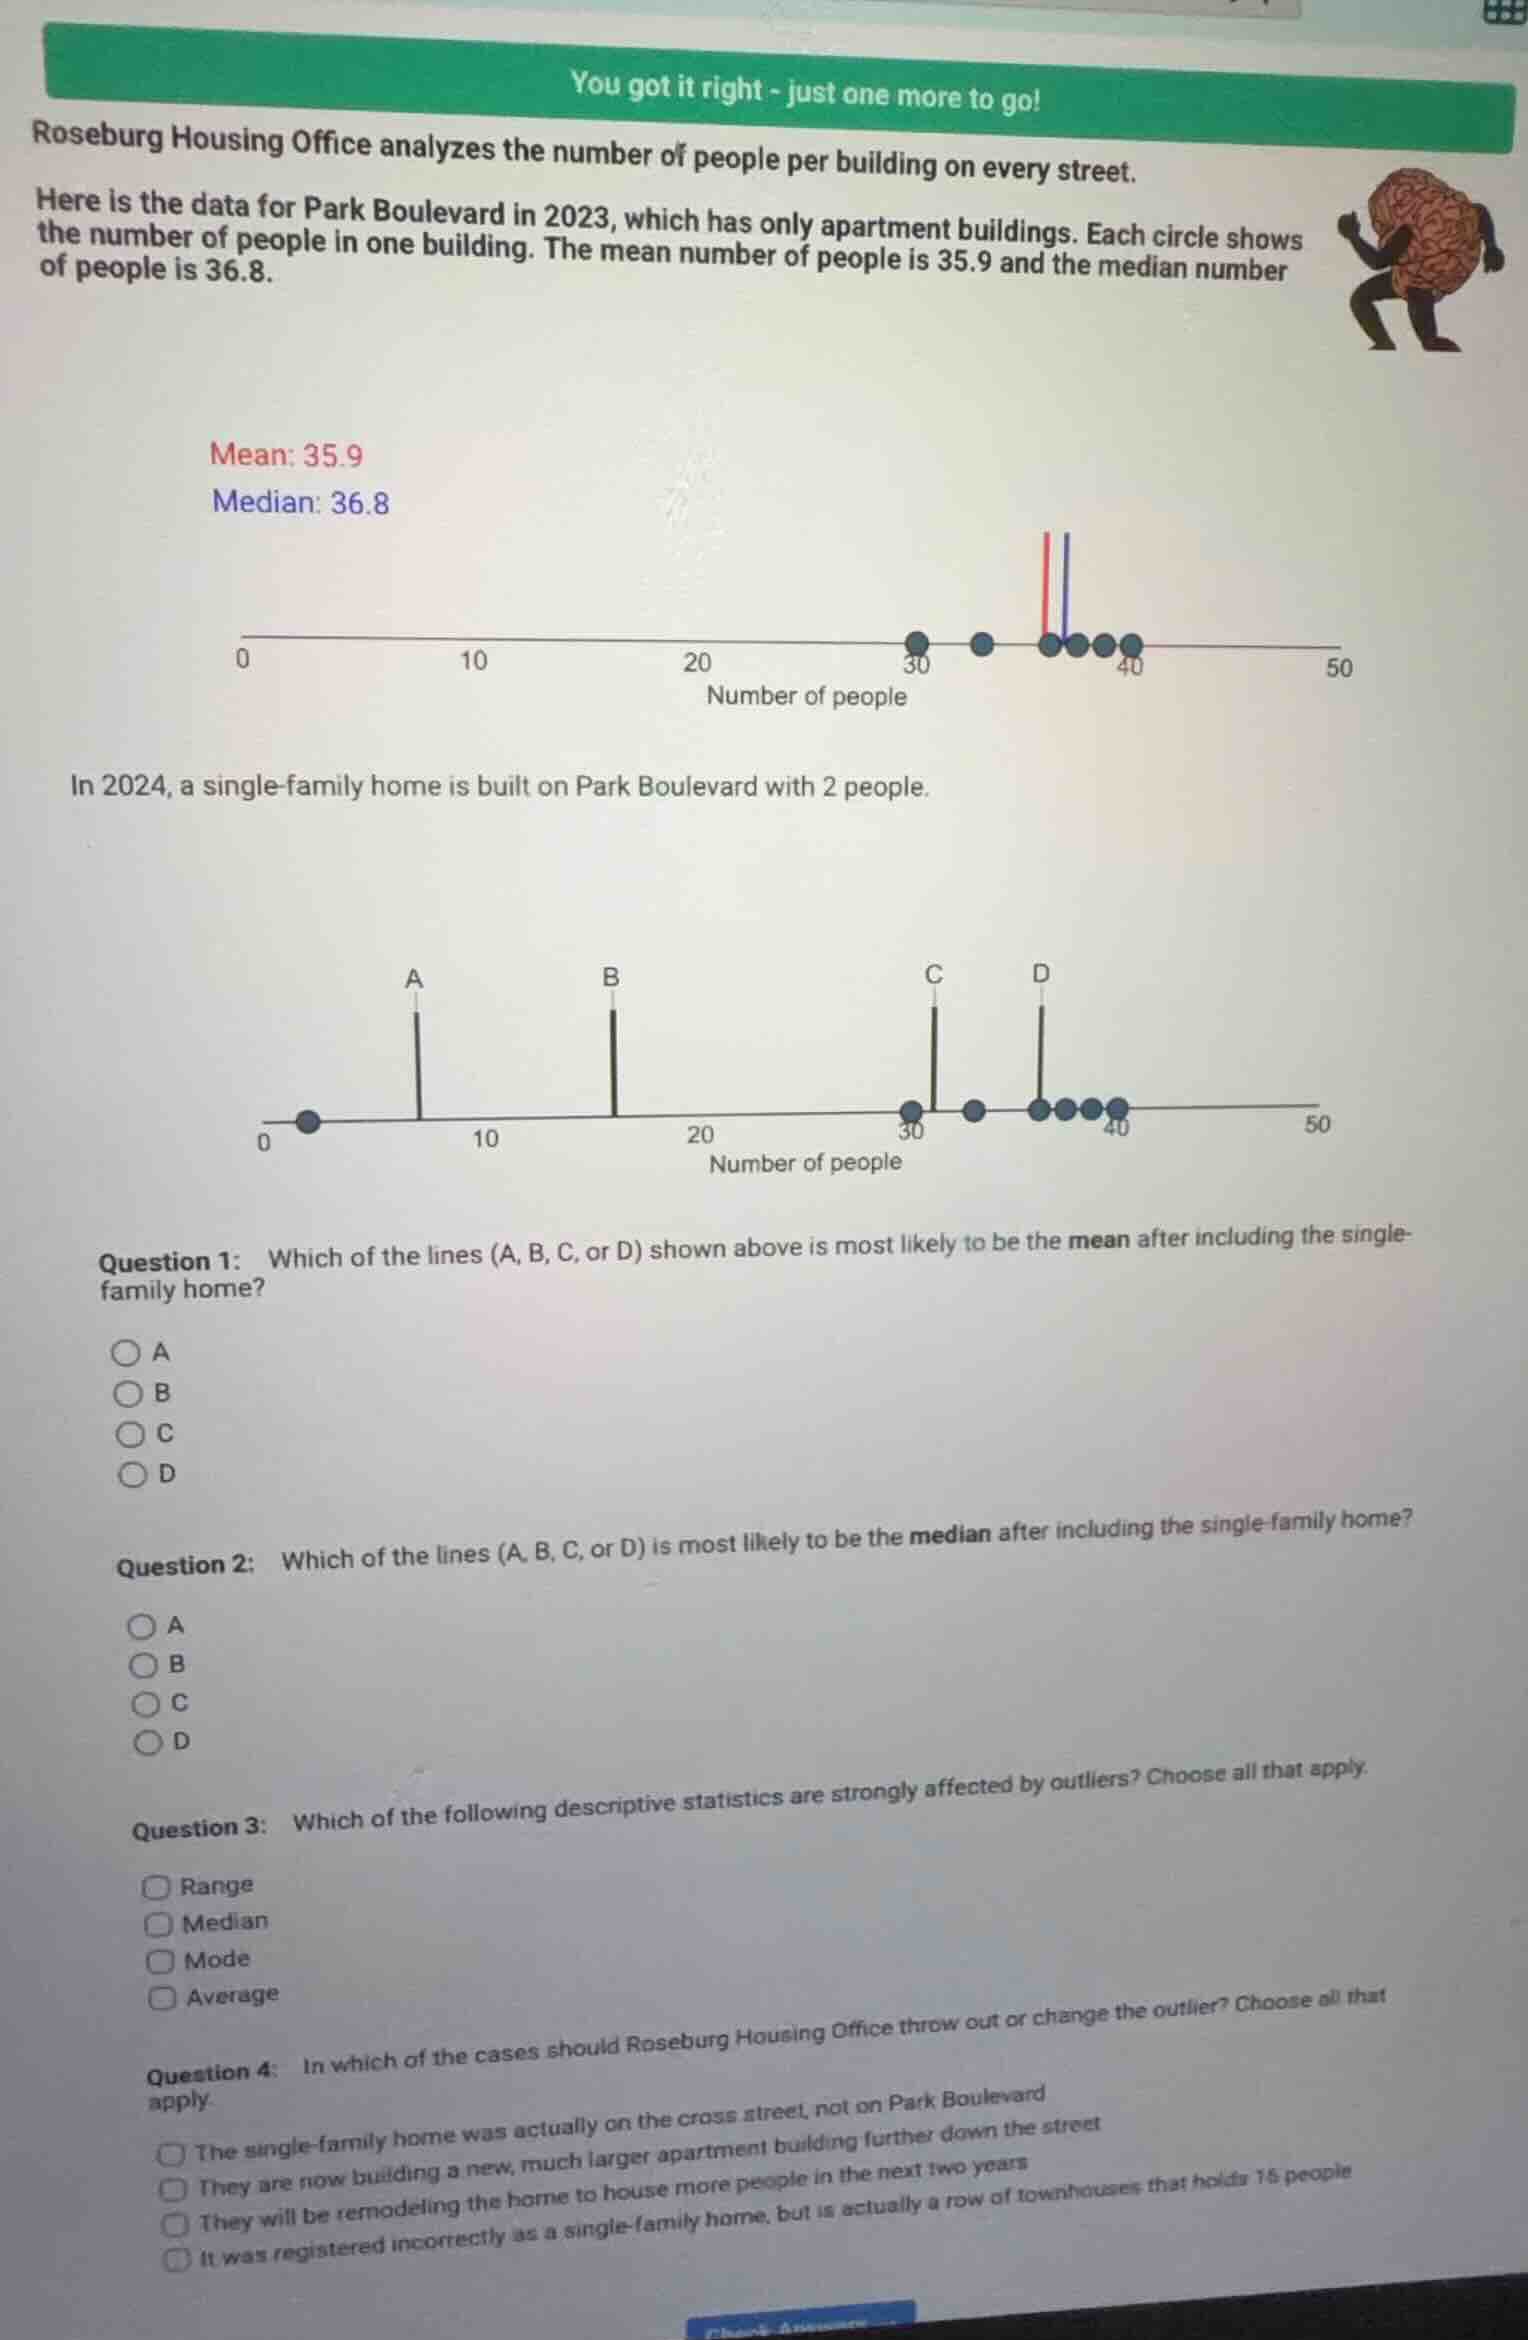
here is the data for park boulevard in 2023, which has only apartment buildings. each circle shows the number of people in one building. the mean number of people is 35.9 and the median number of people is 36.8.
mean: 35.9
median: 36.8
chart with number of people on x - axis from 0 to 50, circles at 30, a point between 30 and 40, and several points near 40
in 2024, a single - family home is built on park boulevard with 2 people.
chart with number of people on x - axis from 0 to 50, a point at 0, lines a, b, c, d at different positions, and points at 30, a point between 30 and 40, and several points near 40
question 1: which of the lines (a, b, c, or d) shown above is most likely to be the mean after including the single - family home?
a
b
c
d
question 2: which of the lines (a, b, c, or d) is most likely to be the median after including the single family home?
a
b
c
d
question 3: which of the following descriptive statistics are strongly affected by outliers? choose all that apply.
range
median
mode
average
question 4: in which of the cases should roseburg housing office throw out or change the outlier? choose all that apply
the single - family home was actually on the cross street, not on park boulevard
they are now building a new, much larger apartment building further down the street
they will be remodeling the home to house more people in the next two years
it was registered incorrectly as a single - family home, but is actually a row of townhouses that holds 15 people
Step1: Analyze original data count
First, count the original data points from the 2023 plot: there are 7 points (values: 30, 35, 37, 37, 38, 39, 40).
Step2: Calculate new mean for Q1
Original total people: $35.9 \times 7 = 251.3$. Add the new data point (2): new total = $251.3 + 2 = 253.3$. New mean = $\frac{253.3}{8} = 31.6625$. This value is closest to line C.
Step3: Calculate new median for Q2
Original data sorted: [30, 35, 37, 37, 38, 39, 40]. Add 2, new sorted data: [2, 30, 35, 37, 37, 38, 39, 40]. Median is average of 4th and 5th values: $\frac{37+37}{2}=37$, closest to line D.
Step4: Identify outlier-sensitive stats for Q3
Mean (Average) is pulled by outliers; Range increases drastically with outliers. Median and Mode are resistant to outliers.
Step5: Identify valid outlier removal cases for Q4
Outliers should be removed if data is misclassified or misregistered: if the home is not on Park Boulevard, or if it was registered incorrectly.

Snap & solve any problem in the app
Get step-by-step solutions on Sovi AI
Photo-based solutions with guided steps
Explore more problems and detailed explanations
Question 1: C
Question 2: D
Question 3: Range, Average
Question 4: The single-family home was actually on the cross street, not on Park Boulevard; It was registered incorrectly as a single-family home, but is actually a row of townhouses that holds 15 people