QUESTION IMAGE
Question
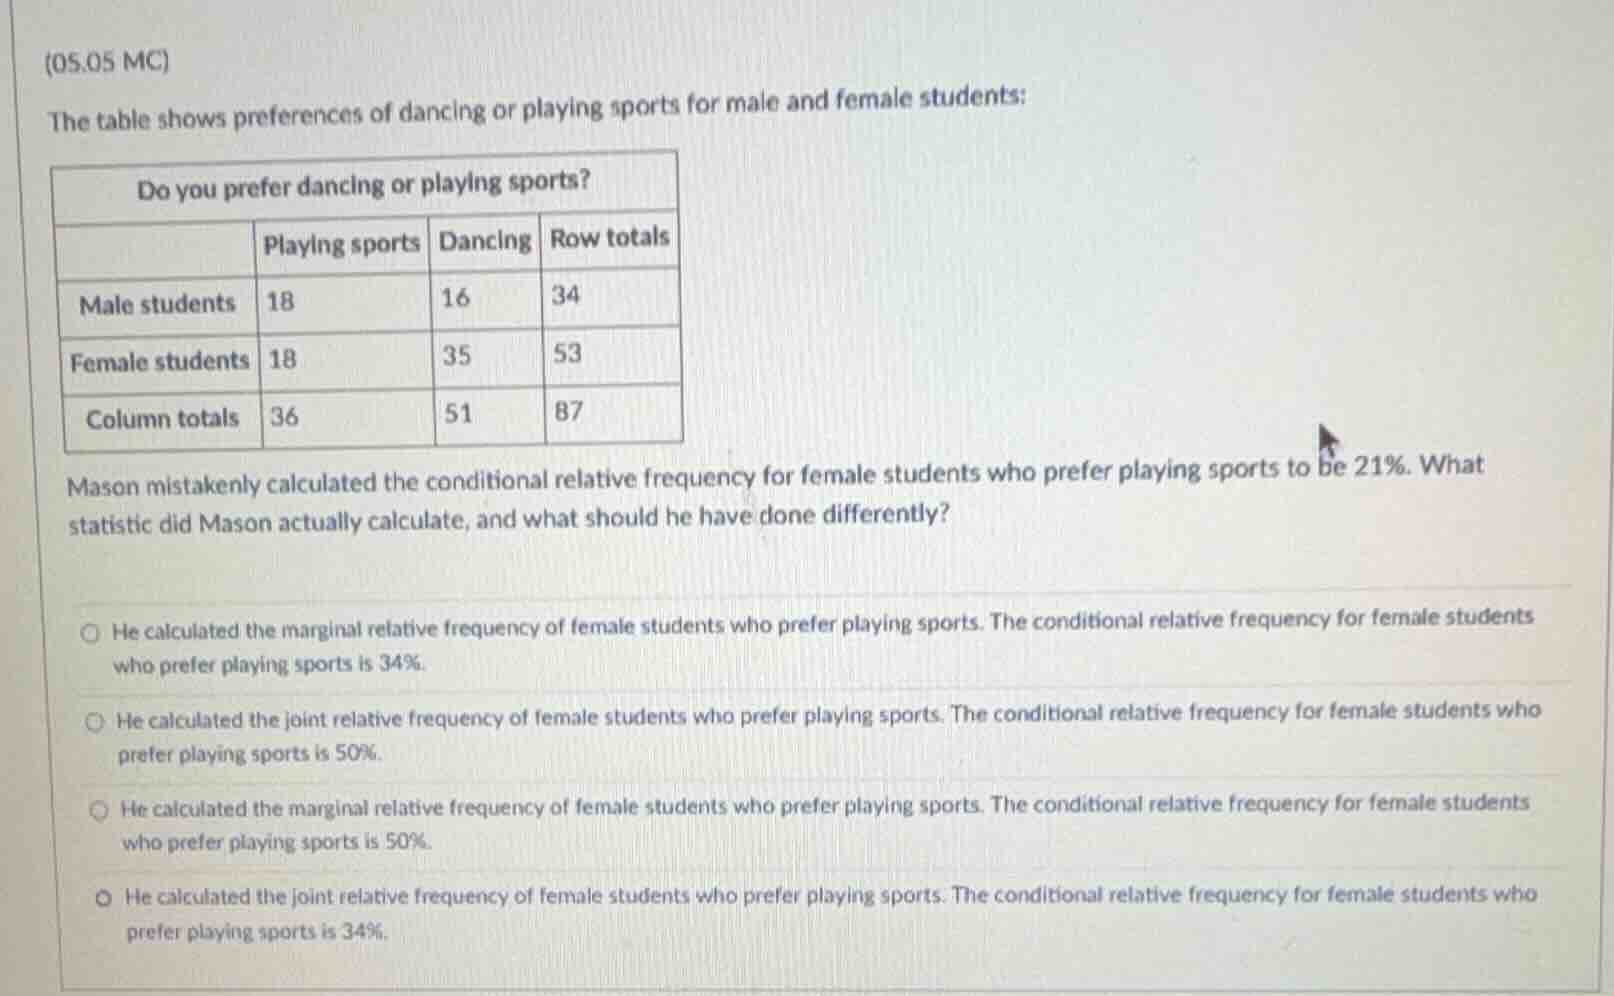
(05.05 mc)
the table shows preferences of dancing or playing sports for male and female students:
do you prefer dancing or playing sports?
mason mistakenly calculated the conditional relative frequency for female students who prefer playing sports to be 21%. what statistic did mason actually calculate, and what should he have done differently?
○ he calculated the marginal relative frequency of female students who prefer playing sports. the conditional relative frequency for female students who prefer playing sports is 34%.
○ he calculated the joint relative frequency of female students who prefer playing sports. the conditional relative frequency for female students who prefer playing sports is 50%.
○ he calculated the marginal relative frequency of female students who prefer playing sports. the conditional relative frequency for female students who prefer playing sports is 50%.
○ he calculated the joint relative frequency of female students who prefer playing sports. the conditional relative frequency for female students who prefer playing sports is 34%.
Step1: Calculate Mason's 21% value
$\frac{18}{87} \approx 0.207$, or ~21%. This is the joint relative frequency (female who prefer sports divided by total students).
Step2: Calculate correct conditional frequency
Conditional relative frequency for female students who prefer sports uses the female student total as the denominator:
$\frac{18}{53} \approx 0.34$, or 34%.
Step3: Match to correct option
Mason calculated joint relative frequency; the correct conditional value is 34%.

Snap & solve any problem in the app
Get step-by-step solutions on Sovi AI
Photo-based solutions with guided steps
Explore more problems and detailed explanations
He calculated the joint relative frequency of female students who prefer playing sports. The conditional relative frequency for female students who prefer playing sports is 34%.