QUESTION IMAGE
Question
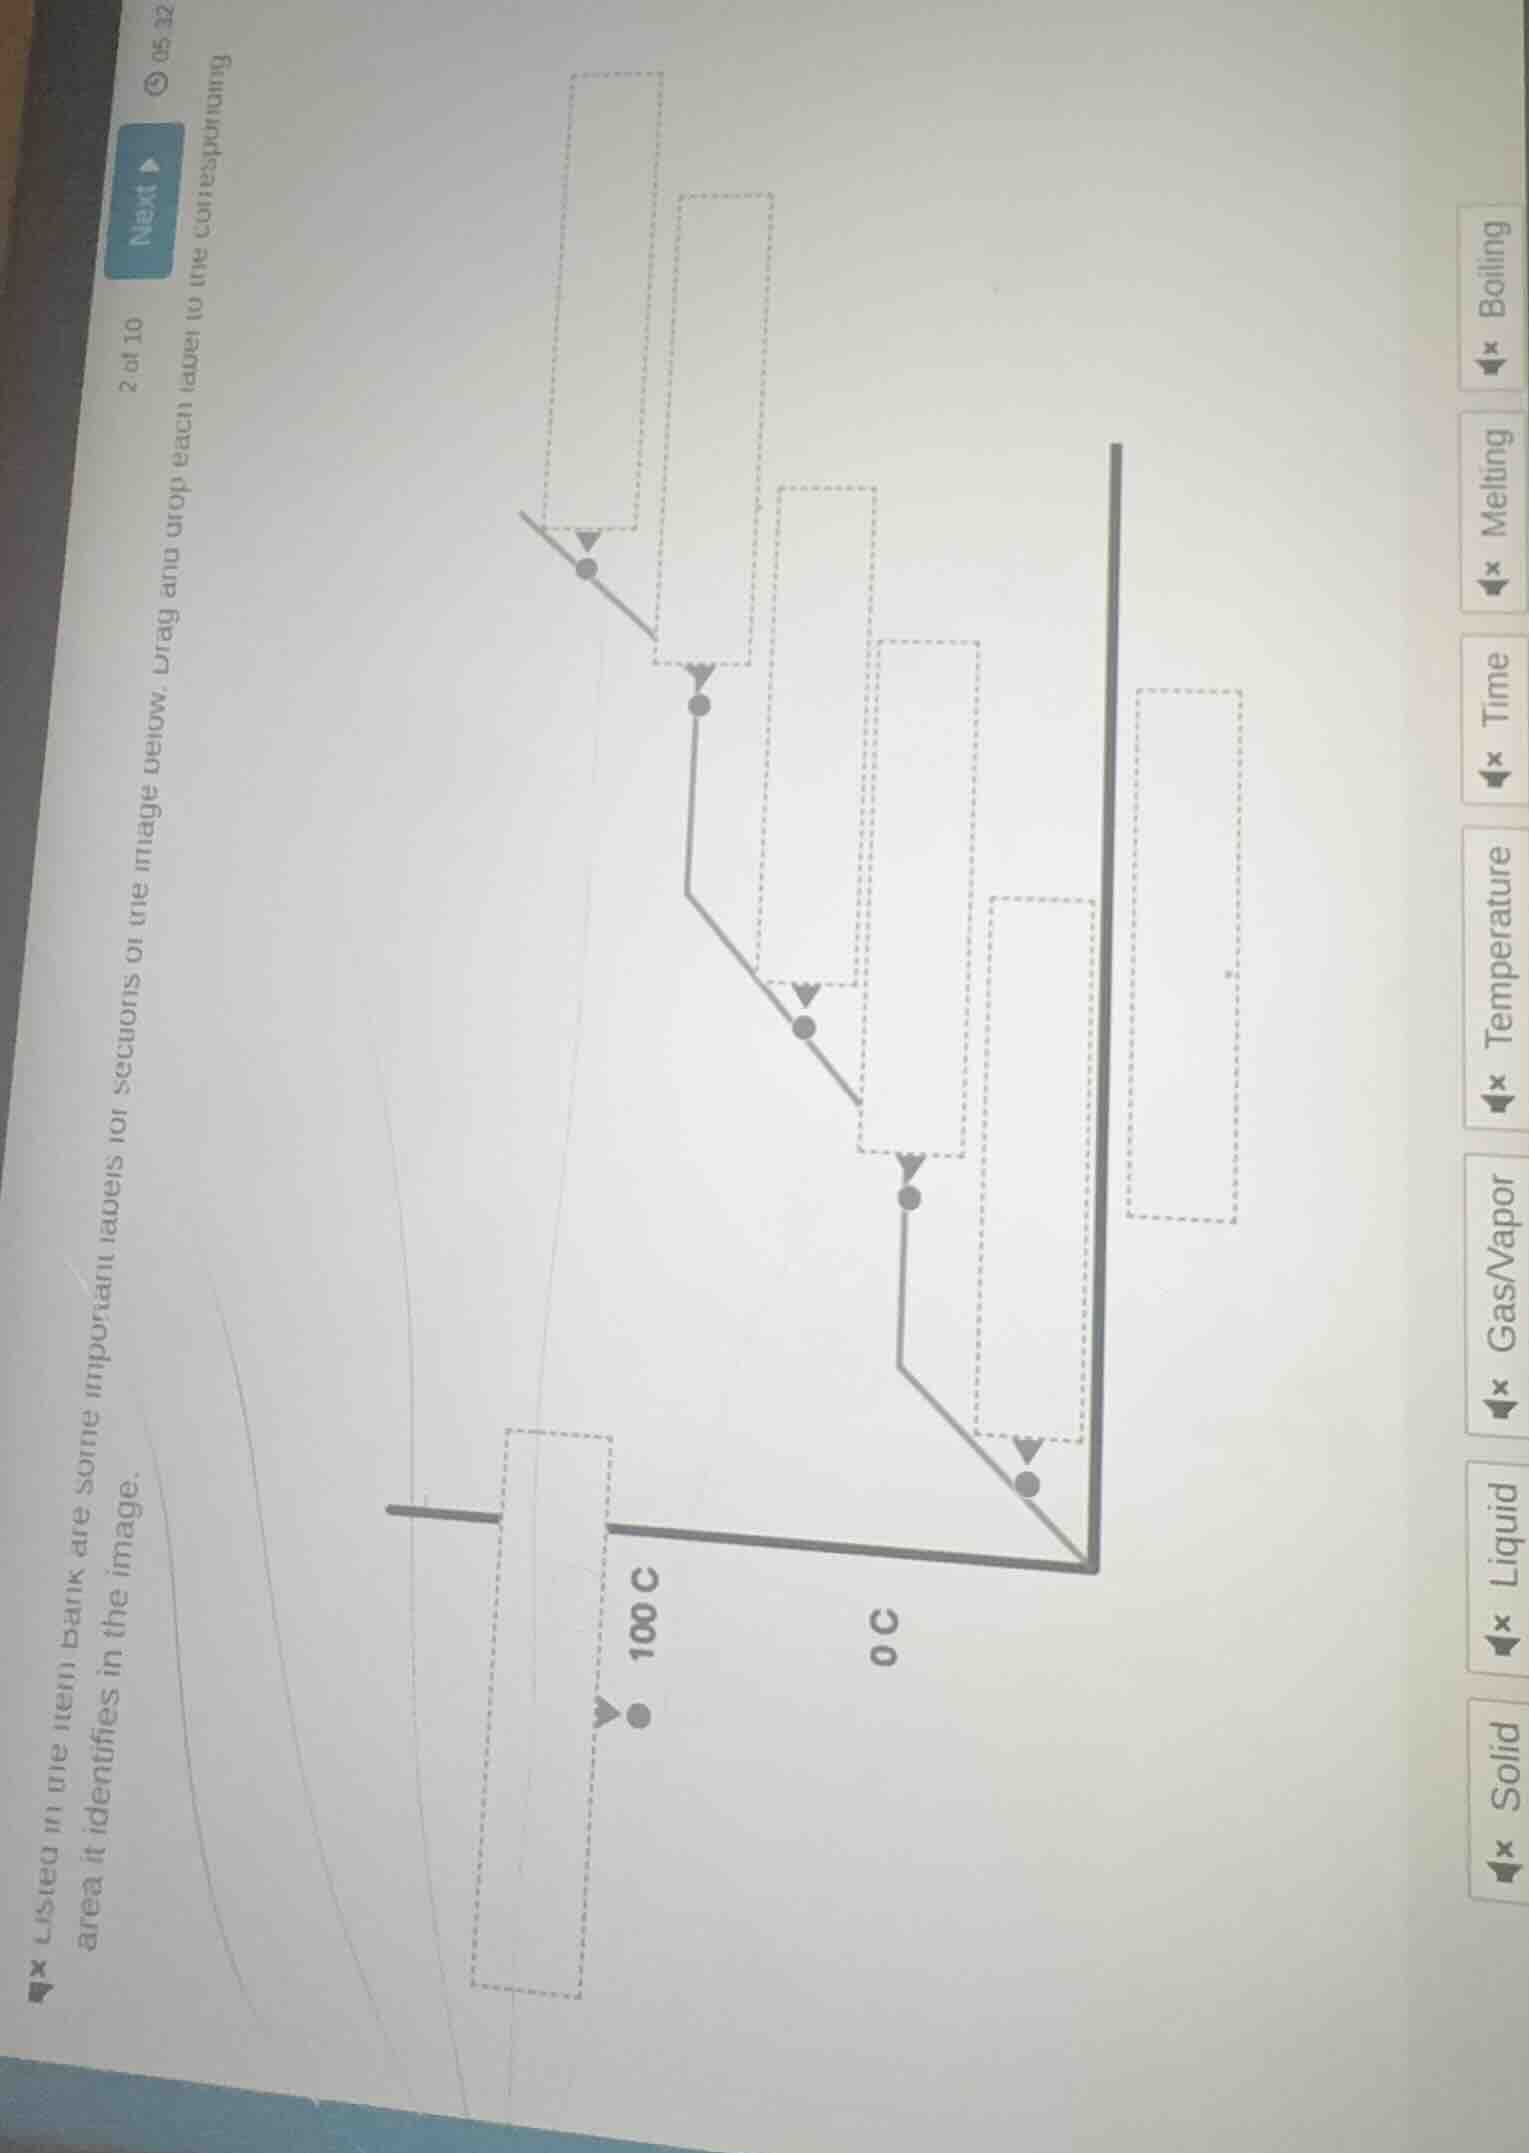
2 of 10 next ▶ listed in the item bank are some important labels for sections of the image below. drag and drop each label to the corresponding area it identifies in the image.
To solve this problem, we analyze the phase - change graph and match the labels:
1. Temperature Axis
The vertical axis with values like \(0^{\circ}\text{C}\) and \(100^{\circ}\text{C}\) represents temperature. So we drag the "Temperature" label to the vertical axis (the one with the temperature values marked).
2. Time Axis
The horizontal axis (the one that progresses from left to right, representing the passage of the process) is for time. We drag the "Time" label to the horizontal axis.
3. Solid Region
The region where the substance is in a solid state (usually at lower temperatures, below the melting point) is labeled "Solid". We identify the area on the graph corresponding to the solid phase and drag the "Solid" label there.
4. Liquid Region
The area between the melting and boiling points, where the substance is in a liquid state, is labeled "Liquid". We find the region on the graph that represents the liquid phase and drag the "Liquid" label to it.
5. Gas/Vapor Region
The area above the boiling point, where the substance is in a gaseous or vapor state, is labeled "Gas/Vapor". We locate the region on the graph corresponding to the gas/vapor phase and drag the "Gas/Vapor" label there.
6. Melting Point
The temperature at which the substance changes from solid to liquid is the melting point. We find the horizontal line (or the temperature value) on the graph where the phase change from solid to liquid occurs and drag the "Melting" label to that position.
7. Boiling Point
The temperature at which the substance changes from liquid to gas is the boiling point. We identify the horizontal line (or the temperature value, like \(100^{\circ}\text{C}\) for water) on the graph where the phase change from liquid to gas occurs and drag the "Boiling" label to that position.
Since this is a drag - and - drop problem, the final answer is obtained by correctly placing each label: "Temperature" on the vertical temperature - marked axis, "Time" on the horizontal axis, "Solid" in the solid - phase region, "Liquid" in the liquid - phase region, "Gas/Vapor" in the gas - phase region, "Melting" at the melting - point temperature, and "Boiling" at the boiling - point temperature (e.g., \(100^{\circ}\text{C}\) for water - related phase changes).

Snap & solve any problem in the app
Get step-by-step solutions on Sovi AI
Photo-based solutions with guided steps
Explore more problems and detailed explanations
To solve this problem, we analyze the phase - change graph and match the labels:
1. Temperature Axis
The vertical axis with values like \(0^{\circ}\text{C}\) and \(100^{\circ}\text{C}\) represents temperature. So we drag the "Temperature" label to the vertical axis (the one with the temperature values marked).
2. Time Axis
The horizontal axis (the one that progresses from left to right, representing the passage of the process) is for time. We drag the "Time" label to the horizontal axis.
3. Solid Region
The region where the substance is in a solid state (usually at lower temperatures, below the melting point) is labeled "Solid". We identify the area on the graph corresponding to the solid phase and drag the "Solid" label there.
4. Liquid Region
The area between the melting and boiling points, where the substance is in a liquid state, is labeled "Liquid". We find the region on the graph that represents the liquid phase and drag the "Liquid" label to it.
5. Gas/Vapor Region
The area above the boiling point, where the substance is in a gaseous or vapor state, is labeled "Gas/Vapor". We locate the region on the graph corresponding to the gas/vapor phase and drag the "Gas/Vapor" label there.
6. Melting Point
The temperature at which the substance changes from solid to liquid is the melting point. We find the horizontal line (or the temperature value) on the graph where the phase change from solid to liquid occurs and drag the "Melting" label to that position.
7. Boiling Point
The temperature at which the substance changes from liquid to gas is the boiling point. We identify the horizontal line (or the temperature value, like \(100^{\circ}\text{C}\) for water) on the graph where the phase change from liquid to gas occurs and drag the "Boiling" label to that position.
Since this is a drag - and - drop problem, the final answer is obtained by correctly placing each label: "Temperature" on the vertical temperature - marked axis, "Time" on the horizontal axis, "Solid" in the solid - phase region, "Liquid" in the liquid - phase region, "Gas/Vapor" in the gas - phase region, "Melting" at the melting - point temperature, and "Boiling" at the boiling - point temperature (e.g., \(100^{\circ}\text{C}\) for water - related phase changes).