QUESTION IMAGE
Question
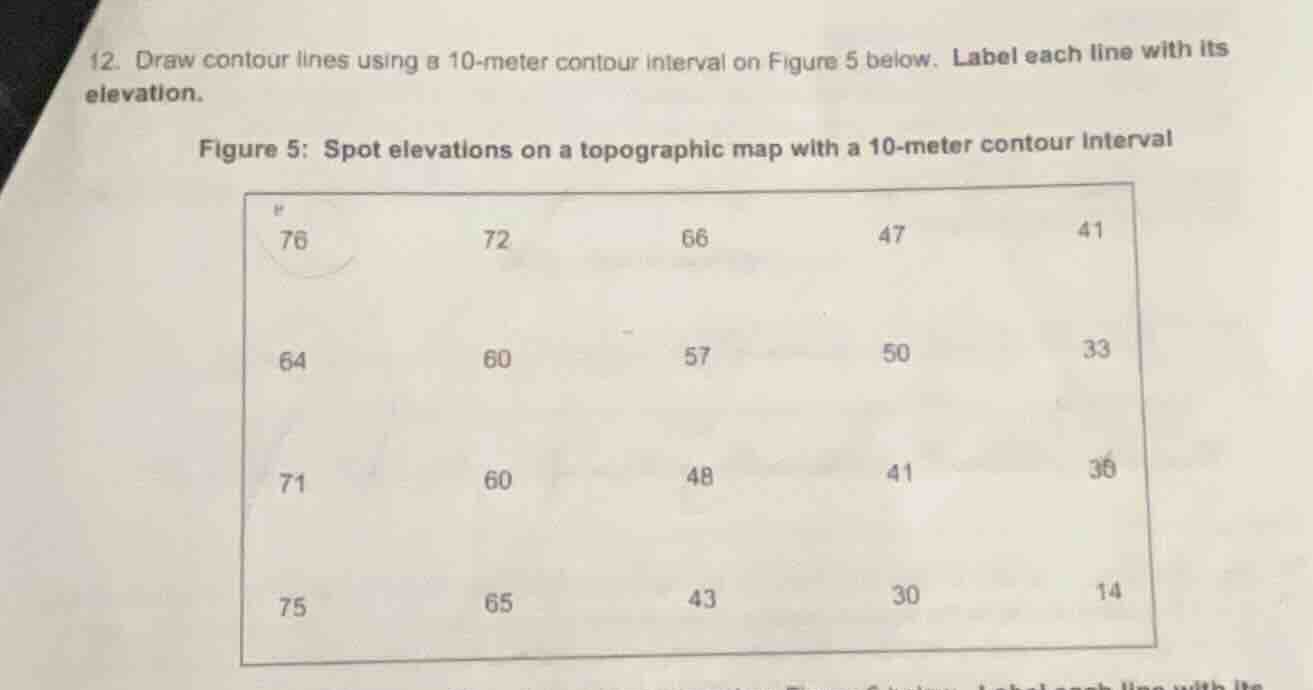
- draw contour lines using a 10-meter contour interval on figure 5 below. label each line with its elevation. figure 5: spot elevations on a topographic map with a 10-meter contour interval 76 72 66 47 41 64 60 57 50 33 71 60 48 41 30 75 65 43 30 14
Step1: Identify elevation range
The lowest spot elevation is 14 m, highest is 76 m. So contour lines needed: 20, 30, 40, 50, 60, 70 m.
Step2: Locate 30m contour
Only the spot elevation 30 exists. Draw a line around/through this point, as it is exactly at the contour.
Step3: Map 40m contour
Connect areas between 33/36 (above 40) and 41/47/48 (above 40) and 30 (below 40). Draw a line that separates points <40 and >40, curving between them.
Step4: Map 50m contour
The spot elevation 50 is exact. Connect areas between 50, 57 (above 50) and 47/48 (below 50). Draw a line through 50, curving to separate <50 and >50 points.
Step5: Map 60m contour
Two spot elevations of 60 are exact. Connect 60, 64/65/71/72/76 (above 60) and 57 (below 60). Draw a line through the 60 points, curving to separate <60 and >60 points.
Step6: Map 70m contour
Connect areas between 71/72/75/76 (above 70) and 64/65 (below 70). Draw a line that separates these points, curving around the higher elevation cluster.
Step7: Label all contours
Mark each drawn line with its corresponding elevation (20, 30, 40, 50, 60, 70). Note: 20m contour encloses the 14m point, separating it from 33/36 (above 20).

Snap & solve any problem in the app
Get step-by-step solutions on Sovi AI
Photo-based solutions with guided steps
Explore more problems and detailed explanations
- Contour lines drawn at elevations: 20 m, 30 m, 40 m, 50 m, 60 m, 70 m
- 20 m: Encloses the 14 m point, separating it from points ≥33 m
- 30 m: Passes through the 30 m spot elevation
- 40 m: Curves between points <40 (30,33,36) and points >40 (41,47,48)
- 50 m: Passes through the 50 m spot elevation, curving between points <50 (47,48) and >50 (57)
- 60 m: Passes through both 60 m spot elevations, curving between points <60 (57) and >60 (64,65,71,72,76)
- 70 m: Curves between points <70 (64,65) and >70 (71,72,75,76)
Each line is labeled with its respective elevation value.