QUESTION IMAGE
Question
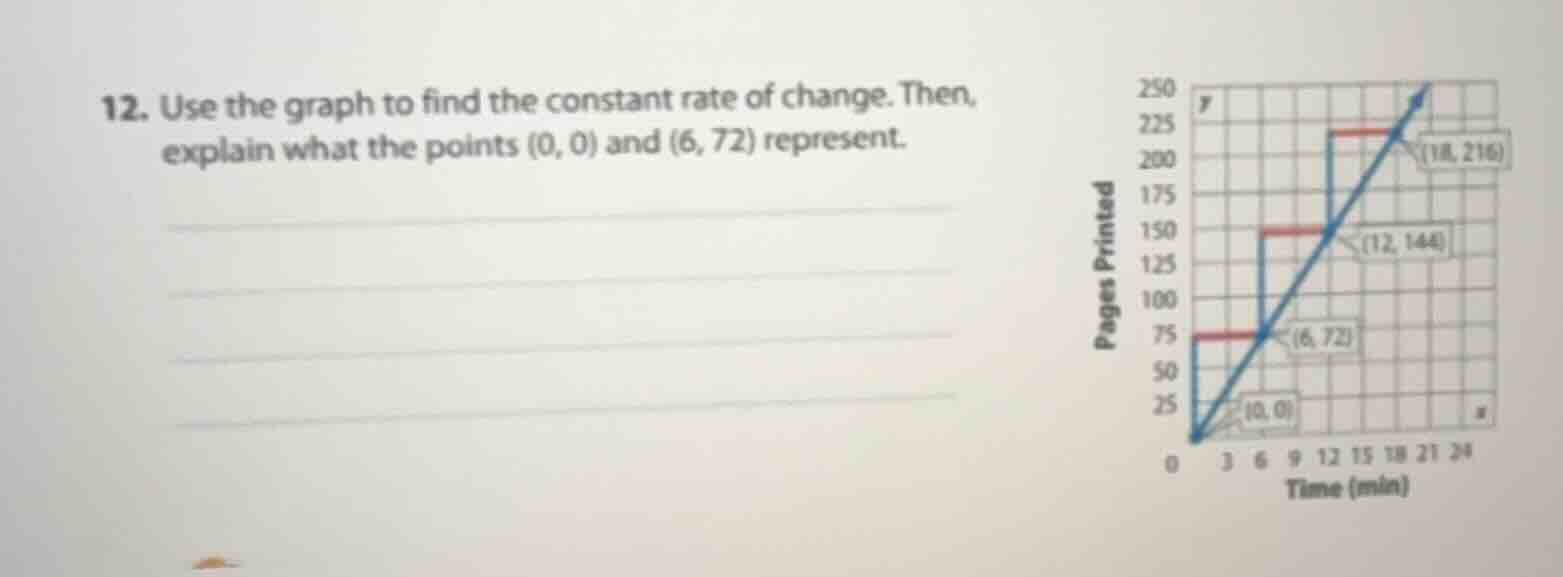
- use the graph to find the constant rate of change. then, explain what the points (0, 0) and (6, 72) represent.
Step1: Calculate rate of change
The constant rate of change is the slope, calculated as $\frac{\text{Change in } y}{\text{Change in } x}$. Using points $(0,0)$ and $(6,72)$:
$\text{Rate of change} = \frac{72 - 0}{6 - 0} = \frac{72}{6} = 12$
Step2: Interpret point (0,0)
The $x$-axis is time (minutes), $y$-axis is pages printed. At $x=0$ (0 minutes), $y=0$ (0 pages printed).
Step3: Interpret point (6,72)
At $x=6$ (6 minutes), $y=72$ (72 pages printed).

Snap & solve any problem in the app
Get step-by-step solutions on Sovi AI
Photo-based solutions with guided steps
Explore more problems and detailed explanations
The constant rate of change is 12 pages per minute.
- The point $(0, 0)$ represents that 0 pages are printed after 0 minutes (the starting state of the printer).
- The point $(6, 72)$ represents that 72 pages are printed after 6 minutes.