QUESTION IMAGE
Question
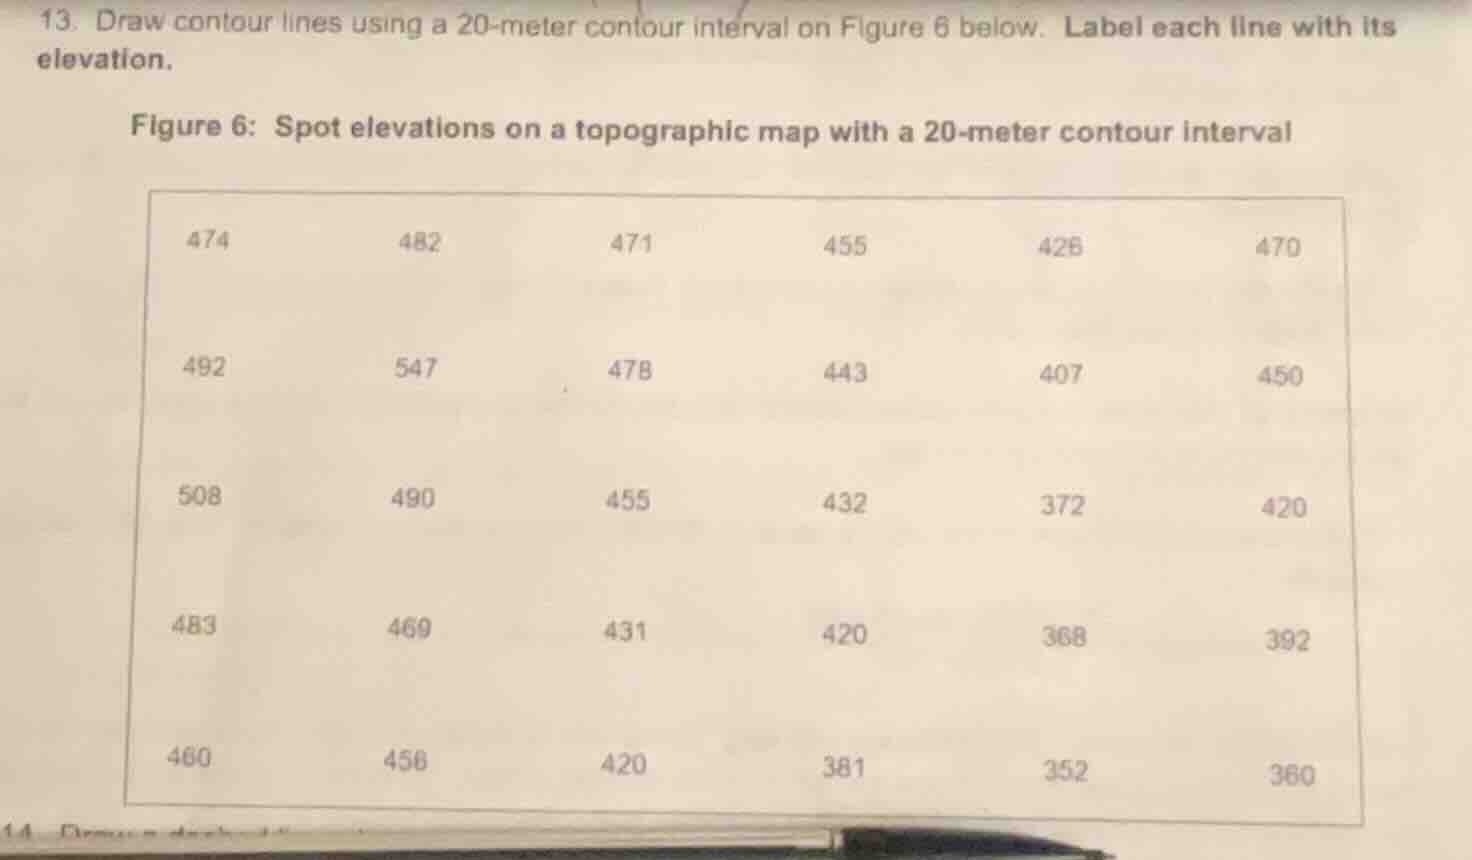
- draw contour lines using a 20-meter contour interval on figure 6 below. label each line with its elevation.
figure 6: spot elevations on a topographic map with a 20-meter contour interval
474 482 471 455 428 470
492 547 478 443 407 450
508 490 455 432 372 420
483 469 431 420 368 392
460 456 420 381 352 360
14
Step1: Identify min/max elevations
Min elevation = 352 m, Max elevation = 547 m
Step2: List contour elevation values
Contours are multiples of 20 m: 360, 380, 400, 420, 440, 460, 480, 500, 520, 540
Step3: Group spots by contour range
- 360 m: Connect points between 350-370 (352, 368, 360)
- 380 m: Connect points between 370-390 (372, 381, 392)
- 400 m: Connect points between 390-410 (407)
- 420 m: Connect points between 410-430 (428, 420, 420, 420, 431, 432)
- 440 m: Connect points between 430-450 (443, 450)
- 460 m: Connect points between 450-470 (455, 455, 458, 460, 469)
- 480 m: Connect points between 470-490 (470, 471, 474, 478, 482, 483)
- 500 m: Connect points between 490-510 (490, 492, 508)
- 520 m: No spots in 510-530, interpolate between 508 and 547
- 540 m: Connect points between 530-550 (547)
Step4: Draw & label contour lines
Sketch smooth lines connecting matching elevation ranges, label each line with its 20m multiple elevation.

Snap & solve any problem in the app
Get step-by-step solutions on Sovi AI
Photo-based solutions with guided steps
Explore more problems and detailed explanations
Contour lines (labeled with elevations 360 m, 380 m, 400 m, 420 m, 440 m, 460 m, 480 m, 500 m, 520 m, 540 m) are drawn as smooth curves connecting points that fall within the respective 20-meter elevation ranges, with each line clearly marked by its assigned elevation value.