QUESTION IMAGE
Question
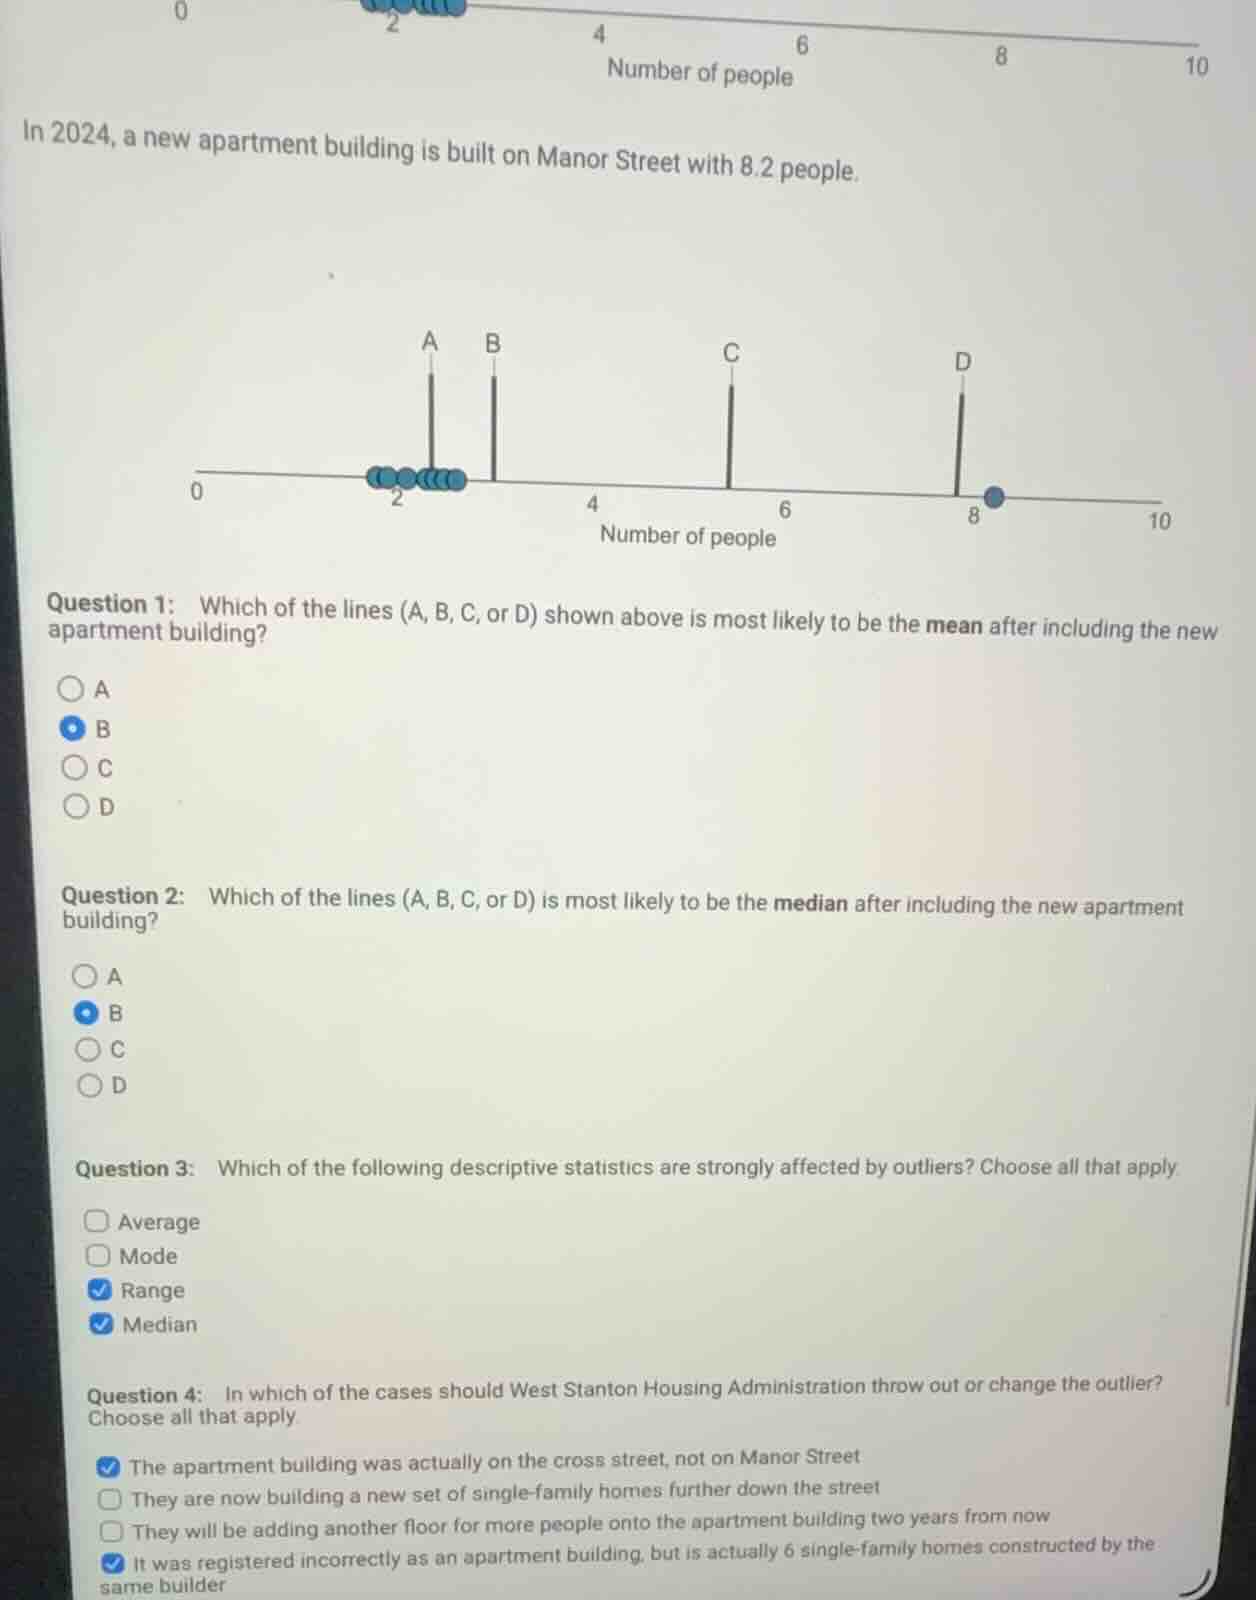
in 2024, a new apartment building is built on manor street with 8.2 people.
question 1: which of the lines (a, b, c, or d) shown above is most likely to be the mean after including the new apartment building?
a
b
c
d
question 2: which of the lines (a, b, c, or d) is most likely to be the median after including the new apartment building?
a
b
c
d
question 3: which of the following descriptive statistics are strongly affected by outliers? choose all that apply
average
mode
range
median
question 4: in which of the cases should west stanton housing administration throw out or change the outlier? choose all that apply
the apartment building was actually on the cross street, not on manor street
they are now building a new set of single - family homes further down the street
they will be adding another floor for more people onto the apartment building two years from now
it was registered incorrectly as an apartment building, but is actually 6 single - family homes constructed by the same builder
Question 1:
Step1: Identify original data
The original data points are all clustered between 2 and 3 (from the dot plot). Let's assume there are $n$ original data points, with a mean $\bar{x}_{old}$ close to 2-3.
Step2: Calculate new mean
The new data point is 8.2. The new mean is $\bar{x}_{new} = \frac{n\bar{x}_{old} + 8.2}{n+1}$. This value will be pulled towards 8.2 from the original mean, but not as far as 8.2 itself. It will be greater than the original mean (2-3) but less than 8.2. Line B is the only one between the original cluster and 8.2 that reflects this shift.
Step1: Understand median behavior
The median is the middle value of a sorted dataset. The original data is clustered at 2-3, so the original median is in this range. Adding one high value (8.2) will shift the median only slightly (if the number of original data points is large, the median will stay near the original cluster; even with a small number, it moves minimally from the original central value). Line B is closest to the original cluster.
- Average (Mean): It uses all values in calculation, so outliers pull it strongly in their direction.
- Mode: It is the most frequent value, so outliers do not affect it.
- Range: It is calculated as $\text{Max value} - \text{Min value}$, so an outlier will drastically increase the max (or decrease the min), changing the range.
- Median: It is the middle value, so it is resistant to outliers and only shifts slightly even with extreme values.

Snap & solve any problem in the app
Get step-by-step solutions on Sovi AI
Photo-based solutions with guided steps
Explore more problems and detailed explanations
B
---