QUESTION IMAGE
Question
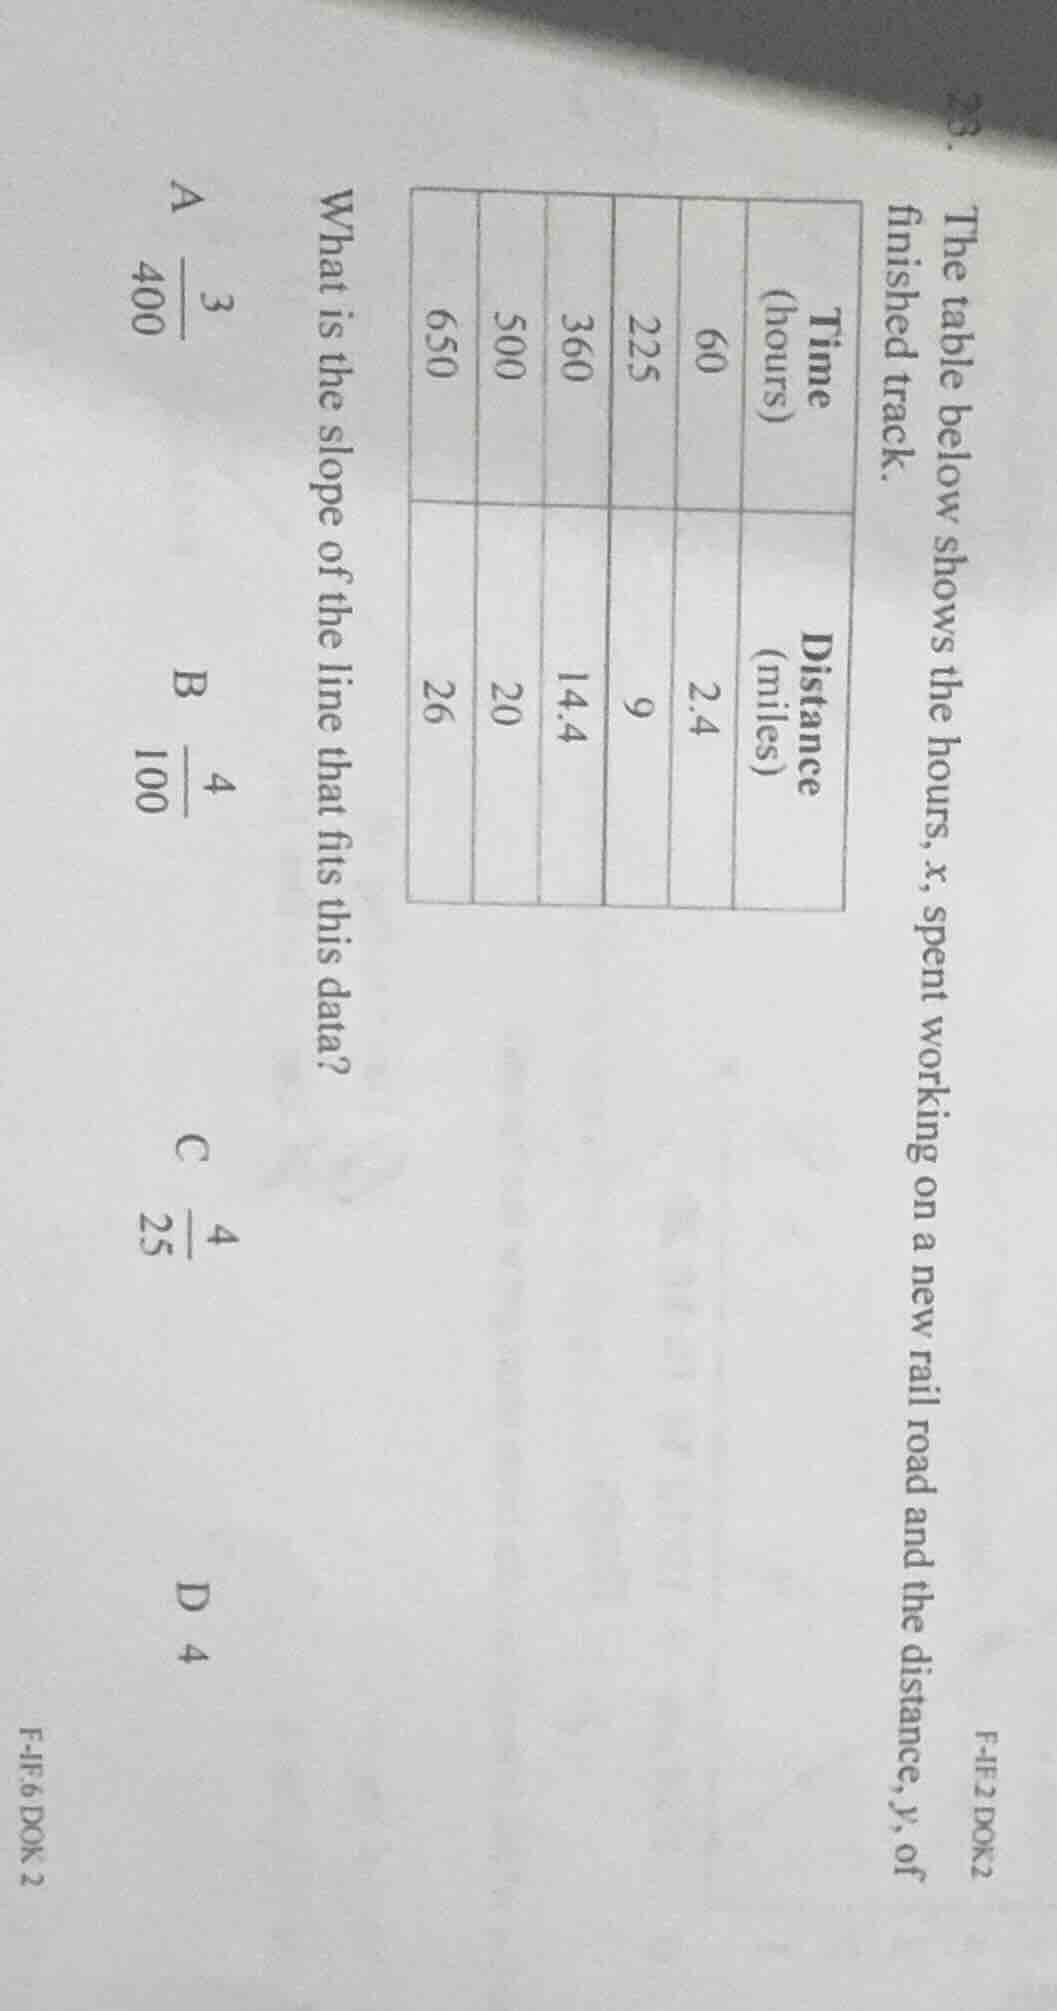
- the table below shows the hours, x, spent working on a new rail road and the distance, y, of finished track.
| time (hours) | 60 | 225 | 360 | 500 | 650 |
|---|
what is the slope of the line that fits this data?
a $\frac{3}{400}$
b $\frac{4}{100}$
c $\frac{4}{25}$
d 4
Step1: Recall slope formula
Slope $m = \frac{y_2 - y_1}{x_2 - x_1}$, where $(x_1,y_1)$ and $(x_2,y_2)$ are data points.
Step2: Pick first two data points
Use $(60, 2.4)$ and $(225, 9)$:
$m = \frac{9 - 2.4}{225 - 60}$
Step3: Calculate numerator and denominator
$9 - 2.4 = 6.6$, $225 - 60 = 165$
$m = \frac{6.6}{165}$
Step4: Simplify the fraction
$\frac{6.6}{165} = \frac{66}{1650} = \frac{2}{50} = \frac{1}{25}$? No, correct simplification: $\frac{6.6}{165} = 0.04 = \frac{4}{100}$
Step5: Verify with another pair
Use $(360, 14.4)$ and $(500, 20)$:
$m = \frac{20 - 14.4}{500 - 360} = \frac{5.6}{140} = 0.04 = \frac{4}{100}$

Snap & solve any problem in the app
Get step-by-step solutions on Sovi AI
Photo-based solutions with guided steps
Explore more problems and detailed explanations
B. $\frac{4}{100}$