QUESTION IMAGE
Question
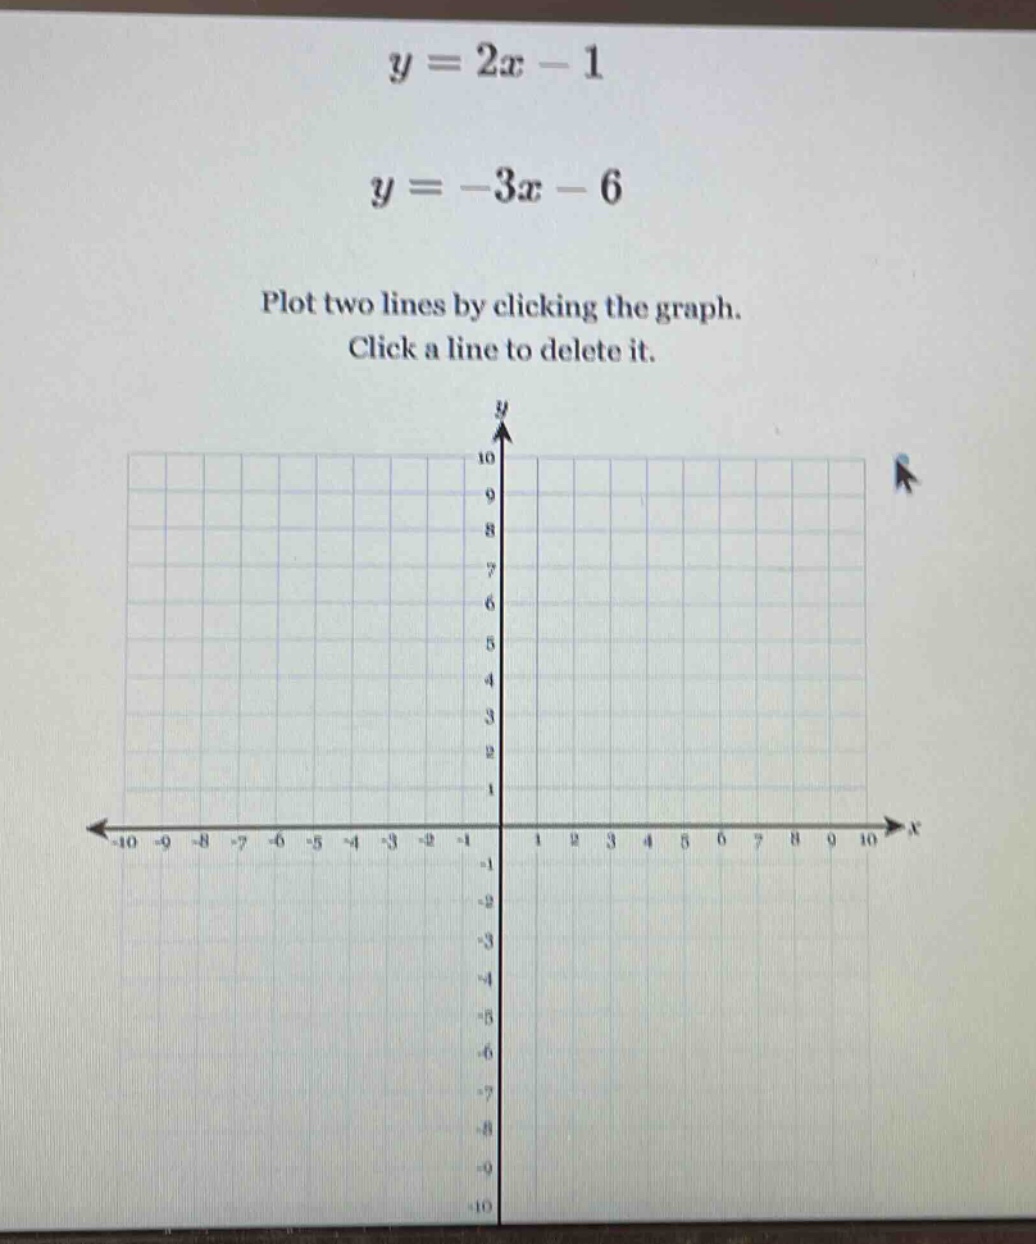
y = 2x - 1
y = -3x - 6
plot two lines by clicking the graph.
click a line to delete it.
Step1: Plot \( y = 2x - 1 \)
To plot the line \( y = 2x - 1 \), we can find two points on the line.
- When \( x = 0 \), \( y = 2(0) - 1 = -1 \). So one point is \( (0, -1) \).
- When \( x = 1 \), \( y = 2(1) - 1 = 1 \). So another point is \( (1, 1) \). We can click these two points on the graph to draw the line.
Step2: Plot \( y = -3x - 6 \)
To plot the line \( y = -3x - 6 \), we find two points:
- When \( x = 0 \), \( y = -3(0) - 6 = -6 \). So one point is \( (0, -6) \).
- When \( x = -2 \), \( y = -3(-2) - 6 = 6 - 6 = 0 \). So another point is \( (-2, 0) \). We can click these two points on the graph to draw the line.
(Note: Since this is a graph - plotting task, the actual plotting is done by clicking the calculated points on the provided coordinate grid. The above steps help identify the points needed for plotting each line.)

Snap & solve any problem in the app
Get step-by-step solutions on Sovi AI
Photo-based solutions with guided steps
Explore more problems and detailed explanations
To plot \( y = 2x - 1 \), use points \((0, -1)\) and \((1, 1)\). To plot \( y = -3x - 6 \), use points \((0, -6)\) and \((-2, 0)\) (click these points on the graph to draw the lines).